ONTAP Discussions
- Home
- :
- ONTAP, AFF, and FAS
- :
- ONTAP Discussions
- :
- Re: any way to list what processes on the filer are taking high CPU time?
ONTAP Discussions
- Subscribe to RSS Feed
- Mark Topic as New
- Mark Topic as Read
- Float this Topic for Current User
- Bookmark
- Subscribe
- Mute
- Printer Friendly Page
any way to list what processes on the filer are taking high CPU time?
- Mark as New
- Bookmark
- Subscribe
- Mute
- Subscribe to RSS Feed
- Permalink
- Report Inappropriate Content
We can see constantly high CPU utilization on the filer running CIFS, and FC, are there any ways to track down what are these processes taking high CPU time?
Thank you for your input!
Solved! See The Solution
- Mark as New
- Bookmark
- Subscribe
- Mute
- Subscribe to RSS Feed
- Permalink
- Report Inappropriate Content
Ah!
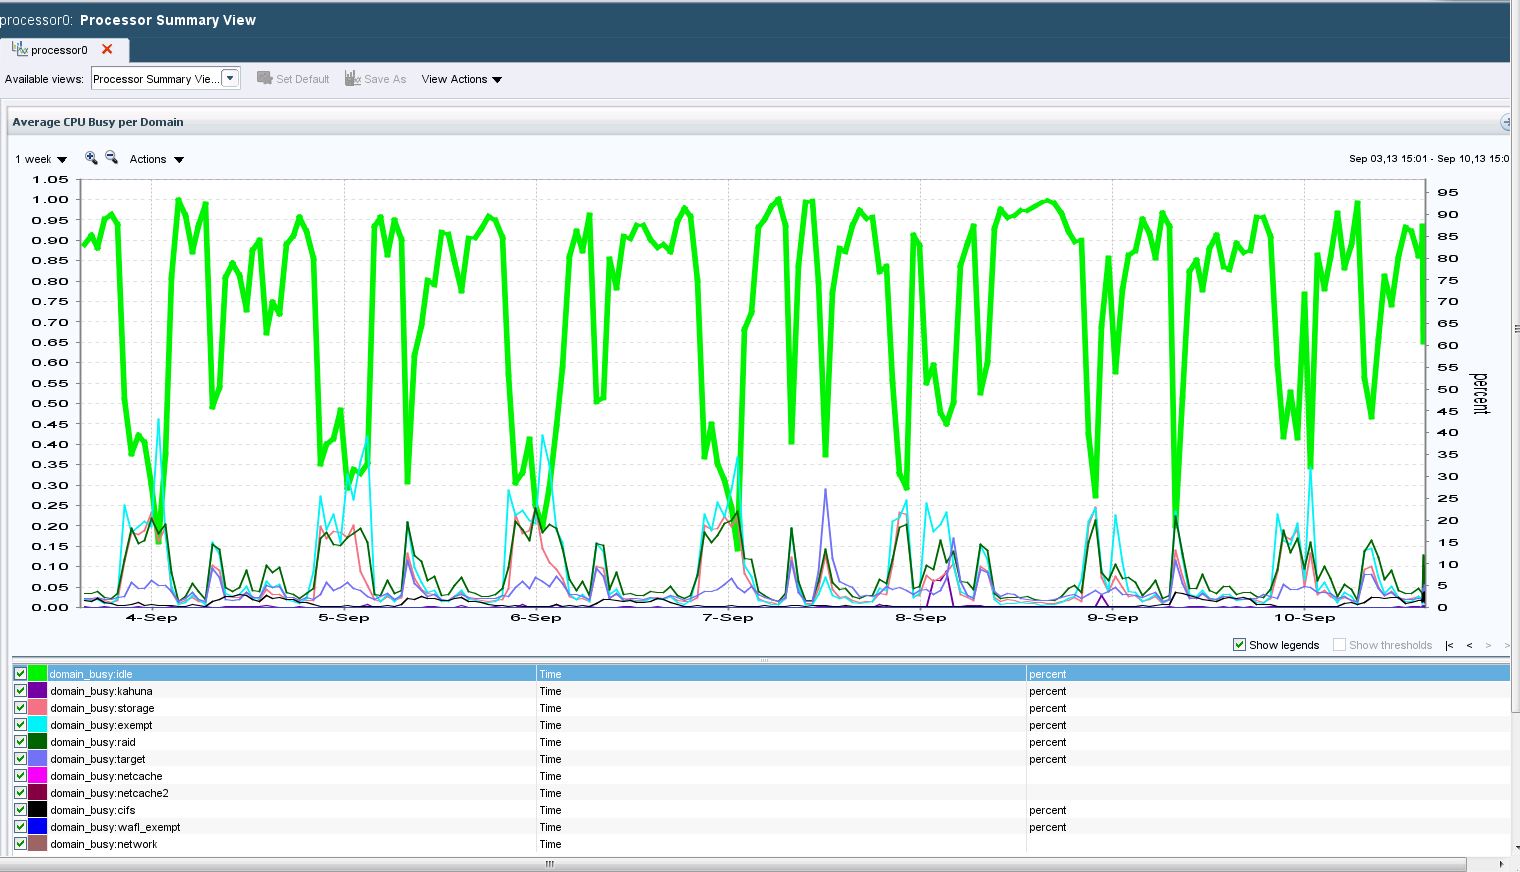
Historic data can be gathered to some degree with Performance Advisor. I took a CPU screenshot from my PA install for Processor Usage over the past week.
This only breaks out operations by domain. It may point you in the right direction from a troubleshooting standpoint, however actual NetApp processes I do not believe can be displayed with this tool.
You could run a perfstat during the time you experience high CPU and then collect the results for post analysis. Otherwise I am not sure of what other "built in" tool can capture and display historic data. Especially on a per process basis.
Some things to check on with regards to your high CPU in the evening:
1) If you are running dedupe on any volumes, check the schedules and make sure that there are not a lot overlapping.
2) The same applies to Snapmirror. If you have many mirrors kicking off all at once, that can tax the CPU.
That is all I can think of at the moment. If I find any more info on collecting process specific info I will let you know!
Cheers! -Mike-
- Mark as New
- Bookmark
- Subscribe
- Mute
- Subscribe to RSS Feed
- Permalink
- Report Inappropriate Content
Can you tell me if the system is running 7-mode or CMODE?
If it is a 7-Mode system, you can SSH into the box, run the "priv set diag" command to enter the diagnostic command list and then do one of 2 things:
USE THESE COMMANDS WITH CARE!!!
1) run the ps command. This will dump every running process to the screen...including CPU time.
2) run the sysstat -M 1 command and you can view the various domains ( such as Kahuna ) and see if anything out of the ordinary is eating CPU time.
If it is a CMODE system,
1) Log into the cluster management IP with an ssh client.
2) type: set diag to enter diag command menu
3) type: spm to enter the Service Process Management sub-menu.
4)t type: show to view all processes controlled by SPM.
That is all I have for CMODE. I am still learning it!
-Mike-
- Mark as New
- Bookmark
- Subscribe
- Mute
- Subscribe to RSS Feed
- Permalink
- Report Inappropriate Content
Hi Michael,
We running 7-mode and 8.0.2. Thanks for your message, but, I did not make myself clear.
I am actually looking for historic data, since high CPU util is happending in the evening. Are there any ways to trace back what are those processes eatting most of CPU time, by using for example Performance Manager? If not, within Peformance Manager, can I trigger an execuation of a script upon the alert I can then run ps command in diag as you suggested?
- Mark as New
- Bookmark
- Subscribe
- Mute
- Subscribe to RSS Feed
- Permalink
- Report Inappropriate Content
Ah!
Historic data can be gathered to some degree with Performance Advisor. I took a CPU screenshot from my PA install for Processor Usage over the past week.
This only breaks out operations by domain. It may point you in the right direction from a troubleshooting standpoint, however actual NetApp processes I do not believe can be displayed with this tool.
You could run a perfstat during the time you experience high CPU and then collect the results for post analysis. Otherwise I am not sure of what other "built in" tool can capture and display historic data. Especially on a per process basis.
Some things to check on with regards to your high CPU in the evening:
1) If you are running dedupe on any volumes, check the schedules and make sure that there are not a lot overlapping.
2) The same applies to Snapmirror. If you have many mirrors kicking off all at once, that can tax the CPU.
That is all I can think of at the moment. If I find any more info on collecting process specific info I will let you know!
Cheers! -Mike-
- Mark as New
- Bookmark
- Subscribe
- Mute
- Subscribe to RSS Feed
- Permalink
- Report Inappropriate Content
Michael, Thanks for looking into it further, and provide all useful infor.
Within Peformance Manager, can I trigger an execuation of a script upon the alert I can then run ps command in diag as you suggested? What time could high CPU happen is random, so far they seem in off office-hours.
- Mark as New
- Bookmark
- Subscribe
- Mute
- Subscribe to RSS Feed
- Permalink
- Report Inappropriate Content
Hi Michael,
Looking into your screen, I could not locate this "processor summary view" screen as shown in your message, would you please advice what tools (Operation Manager, or Performance Manager, or ..) you use to get to this screen?
Thanks for yoru time.
- Mark as New
- Bookmark
- Subscribe
- Mute
- Subscribe to RSS Feed
- Permalink
- Report Inappropriate Content
It is a performance manager tool., you can get this from a processor option under physical view
Saran