Hi @paso
Unfortunately the 'other_ops' bucket is a catch-all counter regardless of requester. There are other counters at the volume level like 'nfs_other_ops' that could be used to see if these are caused by nfs, and the same exist for other protocols, but if the work is not protocol related then we don't have a further breakdown.
One feature I really like with cDOT is the views enabled by QoS counters which are labeled "latency_from_*" in Grafana. If you have a problem with perf on a single volume I would check the "NetApp Detail: Volume" dashboard, pick from the template the group/cluster/svm/volume, and then look at the following row:

From here you will see the overall workload characteristics (throughput, IOPs, latency), understand it's use of cache, and see what layer the latency is coming from.
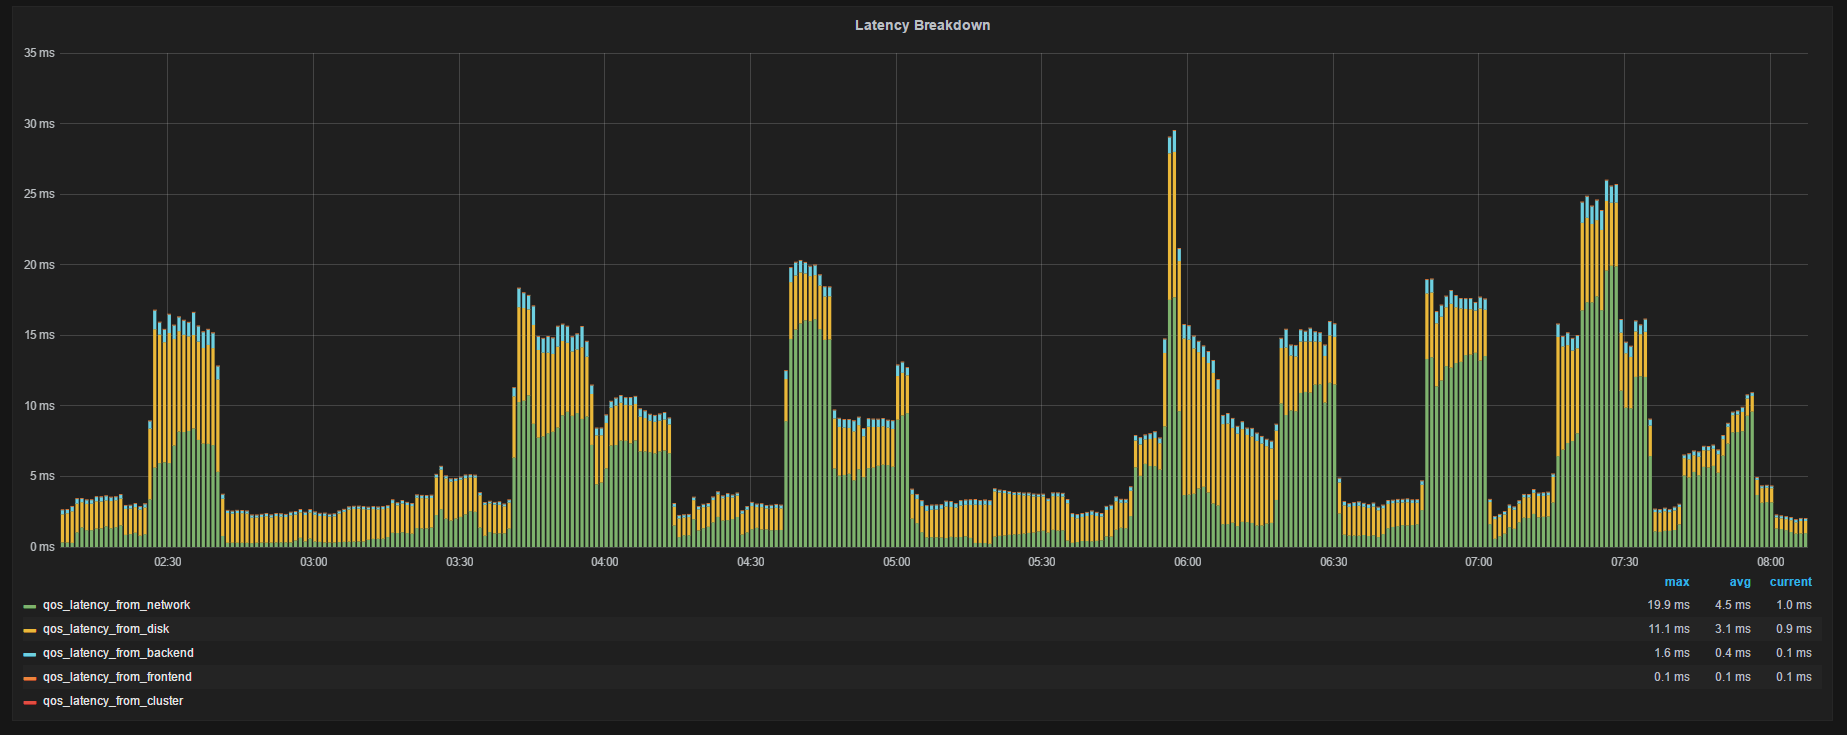
Zooming in on the Latency Breakdown:

Each graph shows the avg latency breakdown for IOs by component in the data path where the 'from" is:
• Network: latency from the network outside NetApp like waiting on vscan for NAS, or SCSI XFER_RDY (which includes network and host delay, here for an example of a write) for SAN
• Throttle: latency from QoS throttle
• Frontend: latency to unpack/pack the protocol layer and translate to/from cluster messages occuring on the node that owns the LIF
• Cluster: latency from sending data over the cluster interconnect (the 'latency cost' of indirect IO)
• Backend: latency from the WAFL layer to process the message on the node that owns the volume
• Disk: latency from HDD/SSD access
So I can see at times I had nearly 30ms avg latency (around 0600) at at that moment the largest contributor was network. Maybe doing the same for your trouble volume will yield some direction on where to investigate. If you still need to go deeper the next step would be to collect a perfstat and open a support case asking the question and referencing the perfstat. For the perfstat I would recommend 3 interations of 5 minutes each while the problem is occurring. Perfstat has more diagnostic info than Harvest collects
Hope this helps!
Cheers,
Chris Madden
Storage Architect, NetApp EMEA (and author of Harvest)
Blog: It all begins with data
If this post resolved your issue, please help others by selecting ACCEPT AS SOLUTION or adding a KUDO