VMware Solutions Discussions
- Home
- :
- Virtualization Environments
- :
- VMware Solutions Discussions
- :
- Re: VSC 7 web frontend shows an HTTP 403 error
VMware Solutions Discussions
- Subscribe to RSS Feed
- Mark Topic as New
- Mark Topic as Read
- Float this Topic for Current User
- Bookmark
- Subscribe
- Mute
- Printer Friendly Page
- Mark as New
- Bookmark
- Subscribe
- Mute
- Subscribe to RSS Feed
- Permalink
- Report Inappropriate Content
Hello,
after successfully deploying VSC 7 and connecting it to my vCenter 6.5u1 (VCSA) instance, I tried to access VSC web frontend at https://vsc.dom.tld:9083 as advised in the documentation. However, after providing user "administrator" using the password set during deployment it just displays:
HTTP ERROR 403
Problem accessing /. Reason:
VASA Provider and SRA services are disabled.
Powered by Jetty://
Then I logged in to VSC console using user maint and tried to start VASA provider and SRA service (we won't use it anyway). But they were already running. "Display server status summary" also displays them as running:
Virtual Storage Console: Running
VASA Provider and SRA: Running
I also checked all other settings and menus in the console: Everything looks fine to me.
Can you tell me whats wrong here?
- Mark as New
- Bookmark
- Subscribe
- Mute
- Subscribe to RSS Feed
- Permalink
- Report Inappropriate Content
Hi,
Is not for VSC.
This is used for accessing VASA/SRA web-cli services.
To access VASA/SRA, first you need to enable VP/SRA service from "manage extensions" link in VSC web UI in vCenter.
Also, going forward it is not recommended for customers to use web-cli for VASA. For all VASA actions one should be able to perform from VSC GUI after enabling VP.
Regards,
Saravana
- Mark as New
- Bookmark
- Subscribe
- Mute
- Subscribe to RSS Feed
- Permalink
- Report Inappropriate Content
It seems that the problem was on the other side:
I did not unregister previous 6.2.1 VSC plugin. After VSC 7 appliance deployment the VSC site within vCenter displayed version 7 but the appearance was like 6.2.1 (I did not have the new dashboard and the manage extension link in configuration. However, I did not realize that there was something wrong.
Then I uninstalled 6.2.1 that finally broke die VSC vCenter integration: The NetApp icon was gone in vCenter.
Hence, I did a complete reinstall: I unregistered NetApp extensons using vcenter/mob Extension Manager and deleted NetApp plugin folders from /etc/vmware/vsphere-client/vc-packages/vsphere-client-serenity/ (btw, the VSC 7 documentation is wrong: It tells us to delete the NetApp plugins from /var/lib/vmware/vsphere-client/vc-packages/vsphere-client-serenity that does not exist in a VCSA 6.5, it's the location previously used; the stop/start web service commands are also wrong for 6.5)
Then I redeployed the VSC appliance once more and now the new VSC dashboard and site is shown in vCenter.
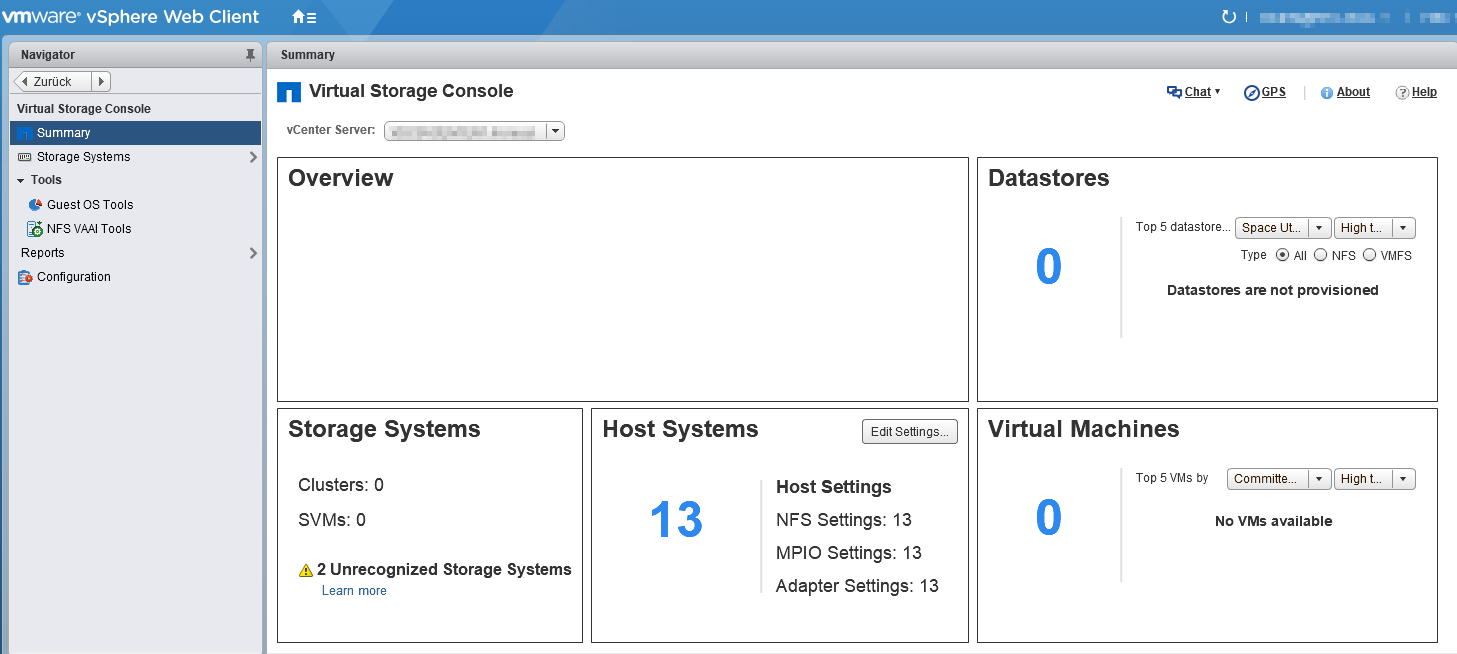
It looks like this now (I guess that overview is empty, since the two storages are not connected yet):
- Mark as New
- Bookmark
- Subscribe
- Mute
- Subscribe to RSS Feed
- Permalink
- Report Inappropriate Content
@CommanderBond wrote:It seems that the problem was on the other side:
I did not unregister previous 6.2.1 VSC plugin. After VSC 7 appliance deployment the VSC site within vCenter displayed version 7 but the appearance was like 6.2.1 (I did not have the new dashboard and the manage extension link in configuration. However, I did not realize that there was something wrong.
Then I uninstalled 6.2.1 that finally broke die VSC vCenter integration: The NetApp icon was gone in vCenter.
Hence, I did a complete reinstall: I unregistered NetApp extensons using vcenter/mob Extension Manager and deleted NetApp plugin folders from /etc/vmware/vsphere-client/vc-packages/vsphere-client-serenity/ (btw, the VSC 7 documentation is wrong: It tells us to delete the NetApp plugins from /var/lib/vmware/vsphere-client/vc-packages/vsphere-client-serenity that does not exist in a VCSA 6.5, it's the location previously used; the stop/start web service commands are also wrong for 6.5)
Then I redeployed the VSC appliance once more and now the new VSC dashboard and site is shown in vCenter.
It looks like this now (I guess that overview is empty, since the two storages are not connected yet):
>> It looks like this now (I guess that overview is empty, since the two storages are not connected yet)
Yes, you have to add the storage systems credentials and run the discovery job manually (if you don't want to wait until the auto discovery of storage system runs).
Wait for the next refresh interval of the dashboard(5 minutes) and click the global refresh button to see the updated data on the dashboard (Overview, Datastores, Virtual Machines Portlets only where as Storage Systems and Host Systems Portlets will update instantaneously every time we refresh the dashboard).
- Mark as New
- Bookmark
- Subscribe
- Mute
- Subscribe to RSS Feed
- Permalink
- Report Inappropriate Content
Unfortunately, we realized that we cannot connect our storage since it's still working in 7-Mode.


