Stay connected during the transition - Join our Discord community today.
Active IQ Unified Manager Discussions
- Home
- :
- Active IQ and AutoSupport
- :
- Active IQ Unified Manager Discussions
- :
- Some OCI & DWH anomalies-Explaination requested
Active IQ Unified Manager Discussions
- Subscribe to RSS Feed
- Mark Topic as New
- Mark Topic as Read
- Float this Topic for Current User
- Bookmark
- Subscribe
- Mute
- Printer Friendly Page
- Mark as New
- Bookmark
- Subscribe
- Mute
- Subscribe to RSS Feed
- Permalink
- Report Inappropriate Content
Sorry for this long post but I've tried to concentrated all issues together that belong all to the same OCI & DWH installation
I’ve found some anomalies on this existing (not mine) OCI installation. Version is 6.4.1 build 297.
Licensed features are: ASSURE, PERFORM e DISCOVER. No PLAN.
First DWH server anomaly
In the Reporting Contents (in Public Folders) the only available templates are under Reports. Performance is empty. All Capacity reports are not available. This last depends because there is no PLAN license? (in the past I’ve always installed OCI with all licenses)
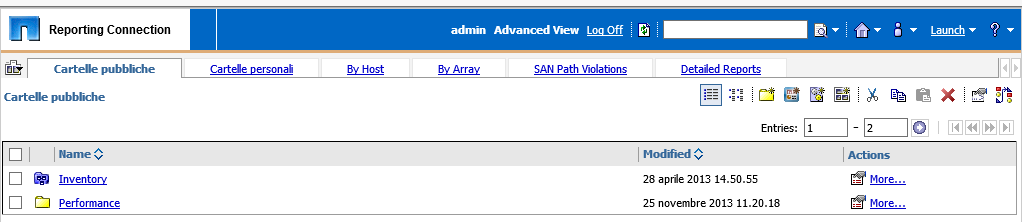
Why there are no reports about Performances?

Second anomaly DWH
In the Launch section are not available many tools to create and manage reports such as Business Insight Advanced, Studio Editor, Report Editor and so on. With only BI there’s no much to do…

Third anomaly DWH
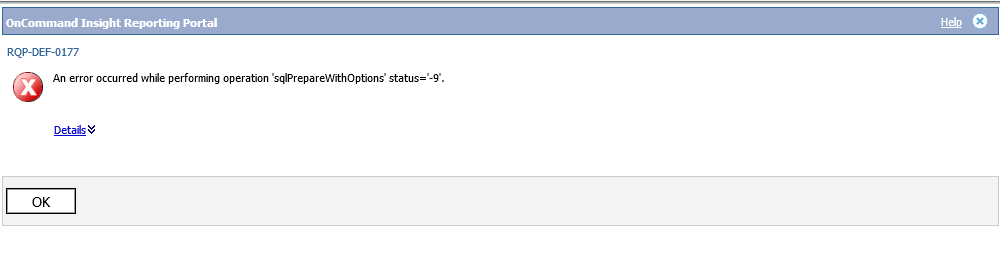
If I run the most of the available report I get always this error.
An error occurred while performing operation 'sqlPrepareWithOptions' status='-9'.
Error happens for every condition: running it by “localhost” on the DWH server itself, calling it by name, IP and using any kind of browser
First OCI issue
Any request of performance data stop itself to one week in the past. Also if I choose a custom time range the elapsed time is plotted but with data only related to just one week before! In the figure you can see I’ve asked data to may 13 that is plotted until that day but data stop the to one week before. I’ve not found any section where to personalize this.

This is another sample. I’ve customized the time range but data are related always to one week in the past, no more

Second OCI issue.
I’ve tried to get some performance data using HiCommand on some USP and VSP arrays. It seems that OCI has all the needed information related to any part of the array but then it seems that OCI has some issue to fine plot them. As you can see the ordinate axis of every data is well scaled until its maximum to contain all data to plot but there’s nothing plotted inside! In the following pics you can see i.e. on the left how the ordinate axis has the right value (12000 IOs, 400 MB/s, 6 ms the first and 6000 IOs, 1200 MB/s, 12 ms the second) but nothing is displayed
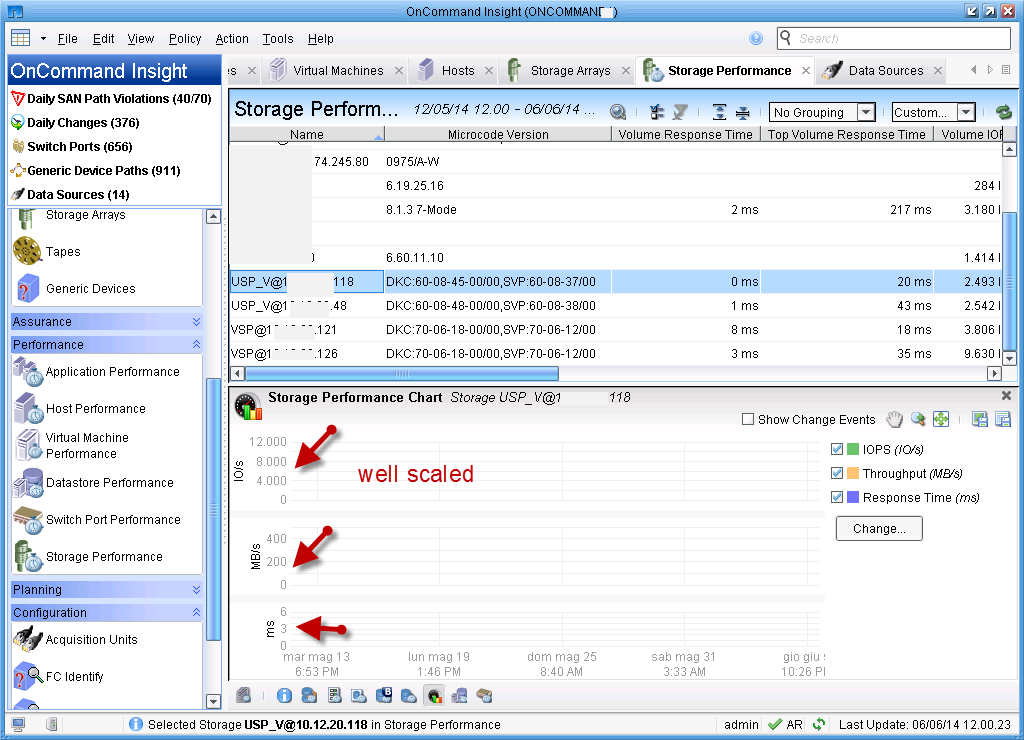

The same happens for an host hosted on that array. The graph is right dimensioned but nothing happens

Third OCI issue
For any object asked to display performances values only the first 40 are displayed. Is there a way to customize this? In case a complete CSV is needed with only this 40 first objects this will not be possible. I’ve also tried to investigate this asking for a similar report using DHW but the lack of templates and availability of modules gives me no chance.

Fourth OCI Issue
Data Sources are polled every 300 seconds but the time range displayed take slices each 60 minutes not less. Is this correct? What If I need a bigger granularity in reports?

- Mark as New
- Bookmark
- Subscribe
- Mute
- Subscribe to RSS Feed
- Permalink
- Report Inappropriate Content
Non DWH answers to questions:
In the operational client, out of the box, we only store 7 days of performance data. So, if you customize the time slice to show > 7 days of data, there is probably not any data to display. There are some ways to increase the amount of performance the OCI operational server stores.
The "Volume Performance Distribution" microview displays hourly summarization data, not the raw performance samples, which are typically more granular. This is why this view displays hourly data. Additionally, this view I believe it limited to a max of 40 objects.
It is not clear to me why the "Volume Performance Chart" is not rendering - OCI does have some requirements for the minimum number of perf samples per hour - if performance collection is unreliable, the charts may not render.
- Mark as New
- Bookmark
- Subscribe
- Mute
- Subscribe to RSS Feed
- Permalink
- Report Inappropriate Content
Hi Matt,
in the operational client, out of the box, we only store 7 days of performance data. So, if you customize the time slice to show > 7 days of data, there is probably not any data to display. There are some ways to increase the amount of performance the OCI operational server stores.
Ok. But this also means that if the customer wants to display more than a week, the last one, this isn't possible. I can understand that having more than 7 days of perf data can be a non sense but the other question I guess customer will ask me will be: "using DWH should it be possible to report more than 7 days?"
The "Volume Performance Distribution" microview displays hourly summarization data, not the raw performance samples, which are typically more granular. This is why this view displays hourly data. Additionally, this view I believe it limited to a max of 40 objects.
Ok. This is also by design. But I would be prepared for same kind of question fm customer like this. "Using DWH can I have this granularity?". After all which is the sense to poll every 5 minutes if I will an hourly mean? This is very important for the customer being a provider that wants to know exactly what and where happens something during the live of a VM i.e.
If I well got you there's no chance to customize the 40 objs or the time granularity.
It is not clear to me why the "Volume Performance Chart" is not rendering - OCI does have some requirements for the minimum number of perf samples per hour - if performance collection is unreliable, the charts may not render.
I remember that this happens only for arrays fm HDS got by HiCommand (the most used by this customer and so the most important to him). Not only the Volume Perf Chart does not display but also the Storage Perf Chart and so on (there are two pics for two different arrays). And this happens nevertheless the data are somewhere in the db! And, again, what if the customer will ask "Can I have these data using DWH?"
I'm waiting for other answers regarding the strange behaviour of the DWH.
Thank you very much.
Regards,
