Active IQ Unified Manager 9.9 Feature Blog: User Experience Enhancements
In our NetApp® Active IQ Unified Manager 9.9 release, we have improved the user experience by simplifying the process for launching NetApp® ONTAP® System Manager and the vCenter Server UI from the Active IQ Unified Manager pages, and by adding support for exclusion filters, filtering Zombie volumes, and a configurable Security Dashboard. In this blog, we discuss these new feature enhancements in detail.
Launching ONTAP System Manager from Active IQ Unified Manager
In this release, you can now launch context sensitive System Manager pages by using the View in System Manager link in the capacity, health, and cluster performance views, and on the aggregate, volume, node, and storage VM inventory pages. You can also access the View in System Manager link for the destination cluster from the Relationships page that lists the protection relationships, and it also enables you to view the same objects in ONTAP System Manager. It is important to note that your context sensitive links to ONTAP System Manager depend on your NetApp ONTAP version, as we show in the table below:
|
ONTAP Version
|
Supported Feature
|
|
ONTAP 9.3 or earlier
|
The cluster inventory, health, and performance pages only have links to System Manager.
|
|
ONTAP 9.4, 9.5, and 9.6
|
The cluster, and volume inventory, health and performance pages have links to the corresponding object in System Manager.
The aggregate, storage VM, node and protection relationship objects have links to the corresponding objects list view (the object home page) in System Manager.
|
|
ONTAP 9.7 and later
(SM. Next starts from ONTAP 9.7)
|
The cluster, volume, aggregate, storage VM, node, and protection relationship objects have context sensitive links to System Manager.
|
In the following images, you can see the View in System Manager link in the Cluster, the Cluster / Health and the Cluster / Performance pages.


In the following image, you can see the View in System Manager link in the Volumes, the Volume / Health, and the Volume / Performance pages.

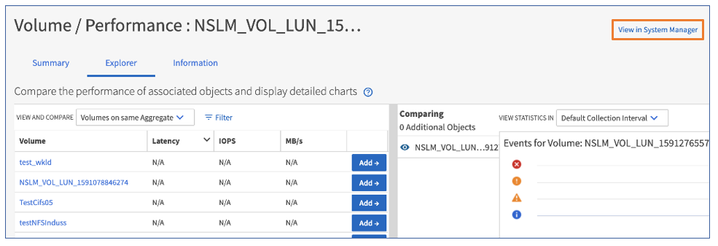
Like the cluster and volumes views above, you can also see the View in System Manager link in the inventory, health, and performance pages for the node, aggregate, and storage VM storage objects.
Launching the vCenter Server UI from Active IQ Unified Manager
You can now access the vCenter Server UI from the vCenter Server menu in the VMware section. In the VMware section, you can launch the vCenter Server UI in a new browser by using the vCenter Server link in the summary topology view for each virtual machine (VM).
The vCenter Server link in VM Page
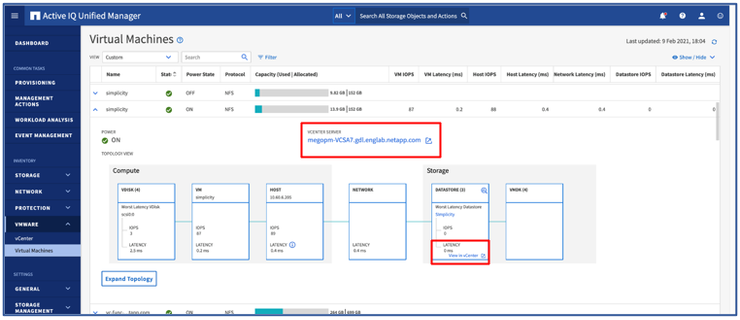
You can also launch the vCenter Server UI in the expanded topology view and then select View in vCenter to see the datastores in the vCenter Server.
The vCenter Server link in the topology

View enhancements
Your enhanced user experience includes improvements to the exclusion filter and filtering inactive volumes options in the inventory pages which help you to optimize your customized views.
The exclusion filter enhancement
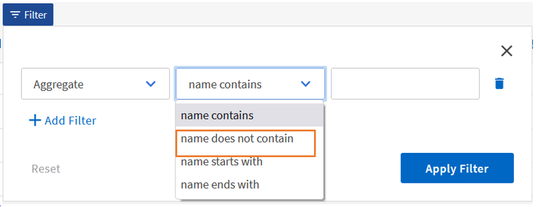
When you create a view by using the does not contain filter, you can now exclude entries from your custom reports. For example, if you would like to filter out volumes with names that don’t contain a particular string, such as MYSQL, you can use the name does not contain filter to list the volumes that don’t contain MYSQL.
The “does not contain” filter
Filtering inactive volumes
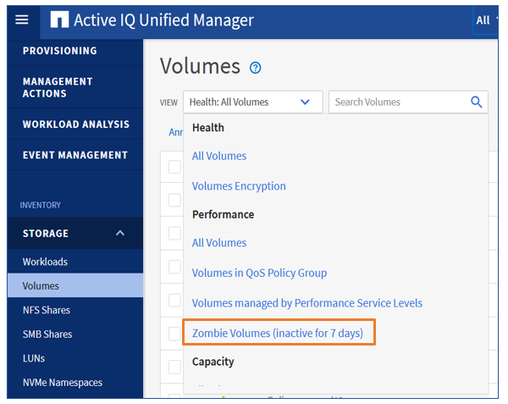
Active IQ Unified Manager 9.9 makes it easy for you to find and reclaim your storage by having the capability to find all inactive volumes. You can now filter Zombie Volumes (inactive volumes) in the Volumes view to create reports and check which volumes can be tiered to the cloud.
The Zombie Volume View.
The configurable Security Dashboard
You now have the capability to configure the Security Dashboard in the Features Settings page by enabling and disabling the Security Dashboard when you don’t want to follow the security settings in the Security Hardening Guide for NetApp ONTAP 9.
By default, the Security Dashboard is enabled. When you want to enable or disable, simply select the Feature Settings tab under the General tab in the left navigation pane. You can then make the changes in the Security Dashboard panel by selecting the slider button to enable or disable, after which a confirmation message appears, and you select Yes to confirm your change.
Disabling the Security Dashboard in the “Features Setting” page

The disabled Security Dashboard
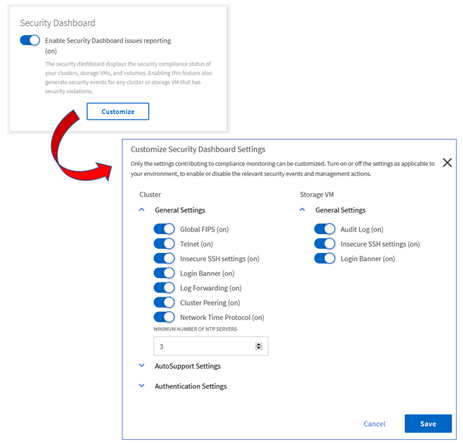
From the Security Dashboard panel under the Feature Settings page, you can also customize the current cluster general security, cluster NetApp® AutoSupport®, cluster authentication, storage VM, and general security settings. However, you can only enable or disable the compliance settings related to clusters and storage VMs. When you disable the existing security settings, your details are logged in the audit log.
Customizing your security settings
Try It Out!
Now that you’ve read about our user enhancements, we hope it entices you to update and try Active IQ Unified Manager 9.9.
If you would like more information, contact us (ng-aiqum-feedback@netapp.com) and we would be happy to answer your questions.