Tech ONTAP Blogs
- Home
- :
- Blogs
- :
- Tech ONTAP Blogs
- :
- Create your own Metrics Monitors with Cloud Insights: ONTAP Essentials
Tech ONTAP Blogs
Create your own Metrics Monitors with Cloud Insights: ONTAP Essentials
Cloud Insights is a powerful tool for analyzing telemetry from a wide variety of sources, from your NetApp on-prem and cloud environments to your 3rd party components in your heterogeneous datacenter. Our previous entries in this series walked through how to get started by connecting a system and enabling Cloud Insight’s predefined monitors for ONTAP.
But what if you want to create your own Alerts? In this edition we’re going to:
- Take a quick look into what telemetry is, and how Cloud Insights collects it.
- Take a deeper look at how monitoring that telemetry works.
- Create a new metric monitor by leveraging a template.
We'll cover Alerts and Monitors from other telemetry feeds in an upcoming post.
What is telemetry?
In order to understand monitors and the alerts they raise, first we need to understand telemetry. Configuration data, Metrics and logs are the 3 most common forms telemetry. Cloud insights can collect these via a variety of methods depending on the source.
 |
Cloud Insights uses industry standard data collection technologies like fluentbit and telegraf to collect and aggregate data from across your datacenter. |
In modern datacenters, technologies like telegraf and fluentbit are commonly used for shipping metrics and logs from systems to aggregators in real time. Cloud Insights supports and uses both in its broad ability to bring telemetry in from different data sources. For Data ONTAP however, NetApp leverages its internal Cloud Connection technology to ship logs, metrics and configuration information efficiently and securely to the cloud, eliminating the need to deploy additional on-prem adjacent software. Our previous post in this series demonstrated how to set that connection up.
Regardless of the collector used to ship telemetry to Cloud Insights, as the data arrives, the data stream is monitored for conditions of interest. ONTAP essentials provides pre-defined monitors for ONTAP based on NetApp best practices, but the focus of todays topic is that you can also create your own.
Telemetry Monitors
A monitor’s job is to look for conditions of interest in the telemetry stream, and when it finds one, document it as an Alert. Cloud Insights has two different kinds of monitors (log focused and metric focused) that allow you to monitor all three telemetry streams. Both follow a similar form:
- They define the data attribute in the telemetry stream to watch, for example ‘volume capacity used percentage’.
- They define conditions or values for that attribute that when observed raise an Alert. Following the same example ‘volume capacity used percentage > 75%’.
- They define any actions to take when the Alert is raised – send an email, raise a ticket in another system via a webhook (API call), etc.
- They also define Breadcrumbs and descriptive documentation that would be helpful to a user who received the Alert.
This simplified picture of Cloud Insights telemetry pipeline illustrates how user visible components of the telemetry pipeline Interact. Kafka is used to manage the flow of data through the system, flink jobs orchestrate the processing. Monitor rules definitions are used to analyze the data stream as its ingested in real time. When a monitor detects it’s condition, alerts are raised and then sent out to interested parties based on notification rules. We’ll talk about each of these below.
Cloud Insights ships with many pre-defined monitors that either apply NetApp best practices or optionally provide examples of how to monitor storage consumer facing services. To view or create your own, go to Observability->Alerts->Manage Monitors.
Metric Monitors
Metric monitors are the simplest form of monitors and focus narrowly on numeric data. The data itself can come from one of three sources:
- raw metrics inbound from a device, an OpenMetrics endpoint or other telegraf source.
- Computed metrics, raw metrics converted in real time to rates, percentages or other simple derived states sometimes referred to as cooked metrics.
- Synthetic metrics: Analytic or AIOPS metrics created by Cloud Insights by looking at many aspects of the monitored system and presenting them as a simple value. For example: predicted number of days until a node reaches performance exhaustion or the number of days until it exceeds the point where it will be able to failover to its partner without a performance impact during an HA event.
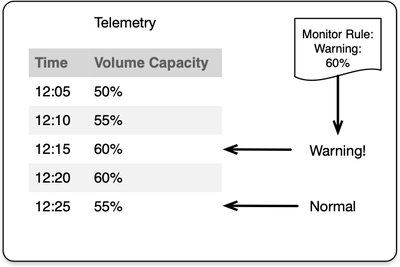
Regardless of the source, metrics are monitored by setting thresholds and watching for the metric value to cross that threshold. Cloud Insight’s Metric Monitors support two thresholds, a warning level and critical level. As a value increases and crosses a threshold, an alert is raised with the severity of the threshold the metric has exceeded. If an alert already exists for the same object, the alert is kept current with whichever threshold state the metric indicates, e.g. raising the alert severity from warning->critical or the alert will be lowered if the metric value crosses back below the level that the metric monitor has defined a warning threshold .
 |
Monitors watch the telemetry stream. Metric monitors watch for values that pass a pre-defined threshold. When they do an Alert is raised, at an indicated severity. If the value drops below the threshold the Alert is resolved. |
Creating your first Metric Monitor
For our example let’s say that you’d like to monitor a specific volume and receive notification when its used capacity exceeds 60%.
The easiest way to get started with your own monitor is to copy one that already exists. This can be done by picking an existing monitor and duplicating it (3 dots on the right) or by clicking on an existing one to view/edit and using the Save As functionality. We’ll use the second method.
Cloud Insights has two groups of system defined monitors for ONTAP, the first group ‘ONTAP Infrastructure’ are monitors we strongly suggest you always enable. This group monitors for failures in the general operation of the device, failed disks, power supplies, or conditions that will cause wide outages like a full storage pool. We showed you how to enable these in the earlier onboarding post.
The second group: ‘ONTAP Workload Examples’ are there as templates for common things you may wish to monitor, but perhaps don’t want to turn on globally. In our test example we have used above, a user running a volume out of space may not be something you generally want to know about. That user may delete some files themselves and not need support. But perhaps a specific volume – your email server, or support database - those are volumes you may wish to monitor. Templates help you get started.
Below let’s select the ONTAP Workload Examples monitor group, in the picture we searched for ‘volume full’ – we can pick and edit the ‘ONTAP Volume Capacity Full’ monitor.
In section one, we see the criteria for what data to monitor, the metric selected and in this case, filters that scope the monitor down to different ONTAP devices. First, lets save this new monitor as something new – we can’t edit pre-defined monitors. Use Save As in the upper right hand corner.
Filters are used to restrict the scope of a monitor – to only look for telemetry that matches the specified criteria. In this example let’s add two fields – cluster name and volume name - to the filter by hitting the plus sign (+) on filter section, enabling the monitor to apply to just a particular volume:
Now this monitor will only watch the volume named voldata1 on clusterA. We can also change when it fires – here we’ll set 60% for warning and 90% for critical in section 2.
And in section 3, we configure an email sent to us when it fires.
With that, you’ve created your first monitor! Remember to turn it on, the example we copied was paused by default.
Checkout the other ONTAP Workload Example monitors. Checkout your alert when it fires on the Alerts page. Perhaps you’d like to monitor latency or IOPS of the email server’s volume as well. There are examples of QTree capacity monitoring and user quotas. Are there additional monitors you’d like to see in examples that are part of your best practices? Please share your thoughts in the feedback.
Next up, Power and Environmental Monitoring.


