Learn More About Cluster-Mode
Want to learn more about Data ONTAP 8 Cluster-Mode operation? Check out these articles from Tech OnTap:
- Enterprise-Ready Scale-Out with Cluster-Mode
- Cluster-Mode NAS Performance and Scalability (SPECsfs benchmark)
- Case Study: PeakColo Accelerates Cloud with Cluster-Mode
More from This Author
Want to read more from this author? Dimitris blogs regularly on topics including storage, performance, backup, recovery, and archiving at recoverymonkey.org. His detailed and technically oriented posts often generate equally detailed and sometimes lively discussions.


NetApp® Data ONTAP® 8 software operating in Cluster-Mode is the industry’s only unified, scale-out storage platform capable of supporting both NAS and SAN protocols from the same cluster. Another article in this issue of Tech OnTap® provides a case study of Cluster-Mode deployment by a fast-growing cloud provider. Previous Tech OnTap articles have described the features and capabilities of Cluster-Mode, as well as its demonstrated performance and scalability on the SPECsfs NFS benchmark. A cluster of 24 FAS6240 systems achieved over 1.5 million low-latency SPECsfs2008_nfs.v3 ops/sec.
The impressive file-serving performance of Cluster-Mode naturally made people curious about its performance on block-oriented workloads. NetApp obliged and recently submitted an SPC-1 benchmark for a six-node FAS6240 cluster in which we demonstrated over 250K SPC-1 IOPS™ (the cluster was built using some of the same components as were used in our SPECsfs testing). The combination of high IOPS and low latency makes this result among the best SPC-1 results submitted for an enterprise disk-based storage system.
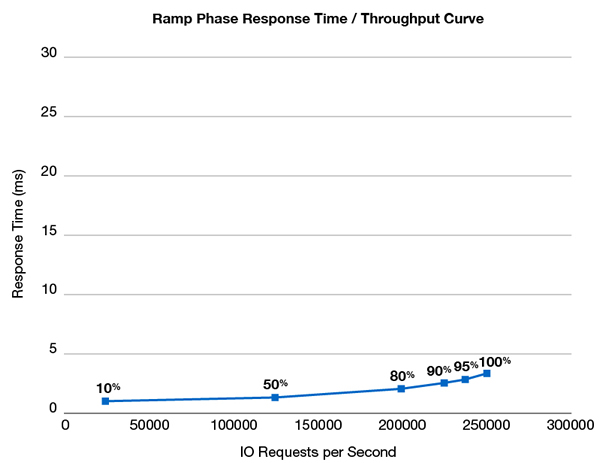
Figure 1) SPC-1 IOPS for a six-node NetApp FAS6240 cluster.
In this article I talk about the SPC-1 benchmark, including the importance of latency. Then I dig into NetApp’s and other recent competing results in more detail and talk about disk versus Flash-based storage.
The SPC-1 Benchmark

The Storage Performance Council (SPC) is a consortium of storage vendors, integrators, and academic institutions created to define, standardize, and promote storage benchmarks. The SPC-1 benchmark of the Storage Performance Council is an industry-standard, audited, tough block-based benchmark that stresses disk subsystems with a mix of I/O that includes writes, overwrites, write after read, read after write, hotspots, and both random and sequential operations. Overall, about 60% of the workload is writes, making this very challenging for storage systems. I/O sizes vary from small to large.
SPC-1 may be the best benchmark available to model the way that databases stress storage systems. When SPC developed the benchmark, it studied how a variety of applications accessed storage and then modeled the workload based on those measurements. The mix of operations is representative of a broad class of applications, roughly half of all commercial applications.
SPC-1 access patterns result in hotspots that are a significant percentage of the total workload. Such hotspots may be either partially cached (if the cache is large enough) or placed on SSD if the storage under test has an automated storage tiering (AST) system that is granular and intelligent enough.
Although no benchmark is perfect, SPC-1 is probably the best standardized benchmark for measuring random block I/O performance and for comparing results between vendors. If a storage system can perform well on SPC-1, it will usually perform extremely well under difficult latency-sensitive, dynamically changing workloads—database applications in general and especially OLTP, plus e-mail and virtualization. The morbidly curious can read the full spec.
SPC-1 is not a throughput-type benchmark; for maximum GB/s look elsewhere.
Interpreting Benchmark Results
The trick with benchmarks is interpreting the results. A single IOPS number may not tell the whole story. There are a number of things to focus on when you look at an SPC-1 report.
Sustainability. All SPC-1 benchmarks include a sustainability test that must be run for a minimum of eight hours. Look for consistently high, sustained IOPs. Performance should not decline during the interval, and the longer the sustain test is, the better.
IOPS/drive. This is a measure of how efficiently the storage system can drive the underlying hardware; 500 IOPS/drive is twice as efficient as 250 IOPS/drive. The ability to use drives more efficiently means that fewer drives are needed to achieve a given level of performance, which results in lower costs and a smaller physical footprint.
Response time (latency). Response time in SPC-1 is a measure of how long the average I/O transaction takes to complete from the point of view of the application. A shorter response time—faster response—is better. It’s possible (but not desirable) to have high IOPS and high response time. For database transactions, a 10-millisecond response time is considered the ceiling for good performance on read operations (above 20 milliseconds databases are considered “broken” by vendors such as Microsoft), whereas writes need to be acknowledged even more quickly and redo log writes need to be acknowledged almost instantly.
These are among the reasons NetApp focuses on achieving low-latency results. For much more on IOPS and latency, check out my recent blog post.
Cost per OP. This is a measure of how many dollars you have to spend for each operation. Essentially, this is the total system price divided by the SPC-1 IOPS achieved. Be warned, however, that some vendors report discount prices while others report list prices, possibly skewing the results.
RAID protection. What type of RAID protection was used for the test? Most SPC-1 results use mirroring (RAID 10 or RAID 1+O) to eliminate parity overhead. In the real world that means you’ll be spending significantly more on disks than you would for similar usable capacity with single-parity or dual-parity RAID.
The overall hardware required. How complex is the hardware configuration? What types of disks were used? Is this a system you’d be likely to deploy in the real world, or a system designed to achieve a good benchmark result?
The NetApp SPC-1 Result
The NetApp SPC-1 result is shown in Figure 1, above. We used a cluster of 6 FAS6240 nodes (3 HA pairs), each with a 512GB Flash Cache module (standard with the FAS6240) and a total of 432 disk drives (450GB, 15K SAS drives, 72 per controller).
Flash Cache is part of the NetApp Virtual Storage Tier (VST); read data that is hot is automatically promoted to Flash. A single FAS6240 controller can support up to 3TB of Flash Cache, so limiting each cluster node to the single 512GB card that comes standard with the system is, if anything, stingy compared to what might be deployed in a typical data center configuration.
Similarly, the use of only 72 drives per controller errs on the low side since a single FAS6240 controller supports up to 1,440 drives. The disks used were 450GB 15K SAS drives. Note that we had RAID-DP® technology, the NetApp double-parity RAID 6 implementation, enabled for all testing. This is consistent with standard customer practices (RAID-DP is the NetApp default). Table 1 summarizes the results of the benchmark relative to the metrics described above.
Table 1) NetApp performance on key SPC-1 metrics.
| NetApp FAS6240 6-Node Cluster | |
| SPC-1 IOPS | 250,039.67 |
| SPC-1 IOPS/Disk | 579 |
| Response Time (latency) | 3.35ms |
| Cost per Op | $6.69 (at list price) |
| RAID Protection | RAID-DP (dual-parity RAID 6) |
| Total Disks | 442 |
| Controllers | 6 |
In addition, we saw no degradation in performance over time with sustainability testing or repeatability testing. As you’ll see in the next section, these are very good results, especially in terms of IOPS at low response time (latency).
Comparison with Other Leading SPC-1 Results
We performed an analysis of leading disk-based SPC-1 results based on a response time threshold of approximately 3 milliseconds. The analysis shows that the NetApp SPC-1 results are among the best for enterprise disk-based systems, given the low latency of the IOPS provided. NetApp is able to achieve performance near the level of Flash, from a configuration based mostly on HDDs.
The 3-millisecond response time target is consistent with the needs of demanding low-latency database applications such as those used by financial firms. For a great majority of database workloads, very low I/O latencies vastly improve database function.
You can see a more exhaustive analysis (plus comments) by reading my recent blog post on these results.
The storage systems that we compared include the following (the hyperlinks below link to the full SPC-1 benchmark report for each storage system):
- NetApp FAS6240 cluster
- IBM SVC with V7000
- IBM SVC with DS8700
- Hitachi Data Systems VSP
- HP 3Par V800
- Huawei Symantec S8100
Table 2) Comparison of NetApp cluster with other leading SPC-1 results.
| FAS6240 Cluster | HDS VSP | Huawei S8100 | IBM SVC +V7000 | IBM SVC +DS8000 | HP 3Par | |
| SPC-1 IOPS | 250,039.67 | 269,506.69 | 300,062.04 | 520,043.99 | 380,489.30 | 450.212.66 |
| Resp Time (ms) | 3.35ms | 5.85ms | 7.08ms | 7.39ms | 7.64ms | 13.67ms |
| List Price ($) | $1,672,602 | $4,934,872 | $2,311,568 | $5,846,630 | $13,672,255 | $5,885,148 |
| $/OP | 6.69 | 18.31 | 7.70 | 11.24 | 35.93 | 13.07 |
| IOPS (~3ms)* | 250,039.67 (3.35) | 242,567.41 (3.23) | 150,000.17 (3.60) | 259,998.37 (2.71) | 190,253.20 (2.96) | 225,079.30 (3.29) |
| # Controllers | 6 | 8 | 16 | 8+32 | 6+4 | 8 |
| # of Disks | 432 | 1,152 | 1,152 | 1,920 | 2,048 | 1,920 |
| IOPS/Disk | 579 | 234 | 260 | 271 | 186 | 234 |
| RAID Type | RAID-DP | RAID 10 | RAID 10 | RAID 10 | RAID 10 | RAID 10 |
*These figures were arrived at by locating the data point for each result closest to the 3ms response time and reporting the IOPS at that point. (Exact response time is shown for each data point.)
SPC-1 IOPS and IOPS/Disk and Cost/Op
Table 2 compares various aspects of the SPC-1 results from the six systems. Admittedly, some of the systems achieve better raw SPC-1 IOPS (first row) than the NetApp FAS6240 cluster. However, NetApp achieves more than two times the IOPS/disk compared to other vendors and also shows the best dollars-per-OP result at list price. I’ve normalized pricing in the table to reflect the list price for all configurations (some vendors report discount prices in SPC submissions, making drawing comparisons without normalizing impossible).
IOPS at Low Latency
When you compare the maximum performance of all systems at 3ms latency (shown in bold in the table), only one system, the IBM SVC with V7000, outperforms the NetApp system, and then by just 4%. That system is about 3.5 times the price of the NetApp cluster at list price, and is dramatically more complicated with 8 SVC virtualization engines, 16 V7000 systems (each consisting of 2 SVC controllers and 2 RAID controllers), and 1,920 15KRPM 146GB disk drives. (That’s probably not a drive you’re buying a lot of these days.) That’s a lot to configure, manage, and power versus the NetApp cluster of 6 controllers with 432 disks.
System Complexity
Overall, the NetApp FAS6240 cluster is able to deliver great results with less hardware and far fewer disks than the other storage systems shown, and it is the only storage array that tested with dual-parity RAID rather than mirroring. That translates into simpler management, lower management and energy costs, and a more real-world configuration overall.
What About Flash?
Although SPC-1 results exist for systems based entirely on DRAM and Flash that demonstrate high IOPS with very low response times, these systems so far don’t deliver the capacity or features that enterprises typically need along with those IOPS. If you have a requirement for very high IOPS with very low capacity, all-Flash or all-DRAM solutions are certainly worth evaluating, but the trade-offs need to be considered.
NetApp offers all-Flash options as well, but for the foreseeable future the economics remain firmly in favor of disk-based or hybrid disk-plus-flash storage systems once your capacity requirement exceeds a few tens of terabytes. Table 3 demonstrates the cost differential with a back-of-the-envelope calculation that shows the rough cost per TB of raw capacity.
Table 3 Cost for capacity: DRAM and Flash arrays versus NetApp cluster.
NetApp FAS6240 Cluster | Kaminario K2-D | TMS RAMSAN- 630 | |
| Raw capacity | 193TB | 3.4TB | 14TB |
| Price | $1,672,602 | $490,760 | $419,292 |
| Price/TB | $8,666 | $140,217 | $29,949 |
Conclusion
With this SPC-1 result, NetApp demonstrates that Data ONTAP 8 Cluster-Mode delivers great performance for both SAN and NAS workloads. Cluster-Mode delivers:
- Low latency (response time) with high performance
- Dynamically scalable, unified clusters for FC, iSCSI, NFS, and CIFS
- Excellent price/performance
- Nondisruptive operations such as data movement across cluster nodes (including CIFS, which is normally next to impossible)
- The Data ONTAP feature set including write optimization, application awareness, Snapshot™ copies, deduplication, compression, replication, thin provisioning, Virtual Storage Tiering, and more
- Ability to use same hardware for Cluster-Mode as for 7-Mode including V-Series platforms that virtualize storage arrays from other vendors