Hello, I am a NetApp partner.
I received an inquiry from a customer, so I would like to ask the community for advice.
Is it possible to know the exact timing of when alerts are generated or cleared in system health subsystem show on NetApp?
As shown below, for Subsystem: Environment, the Subsystem Refresh Interval is displayed as 10m, 10m, 10m:
Subsystem: Environment
Health: ok
Initialization State: initialized
Number of Outstanding Alerts: 0
Number of Suppressed Alerts: 0
Node: aff300-rtp-14a, aff300-rtp-14a, aff300-rtp-14b
Subsystem Refresh Interval: 10m, 10m, 10m
I believe there must be a difference between showing a single 10m and showing 10m, 10m, 10m.
For example, if a PSU goes into a fault state and then returns to normal, it can take much longer than 10 minutes for the System health subsystem to reflect the recovered status.
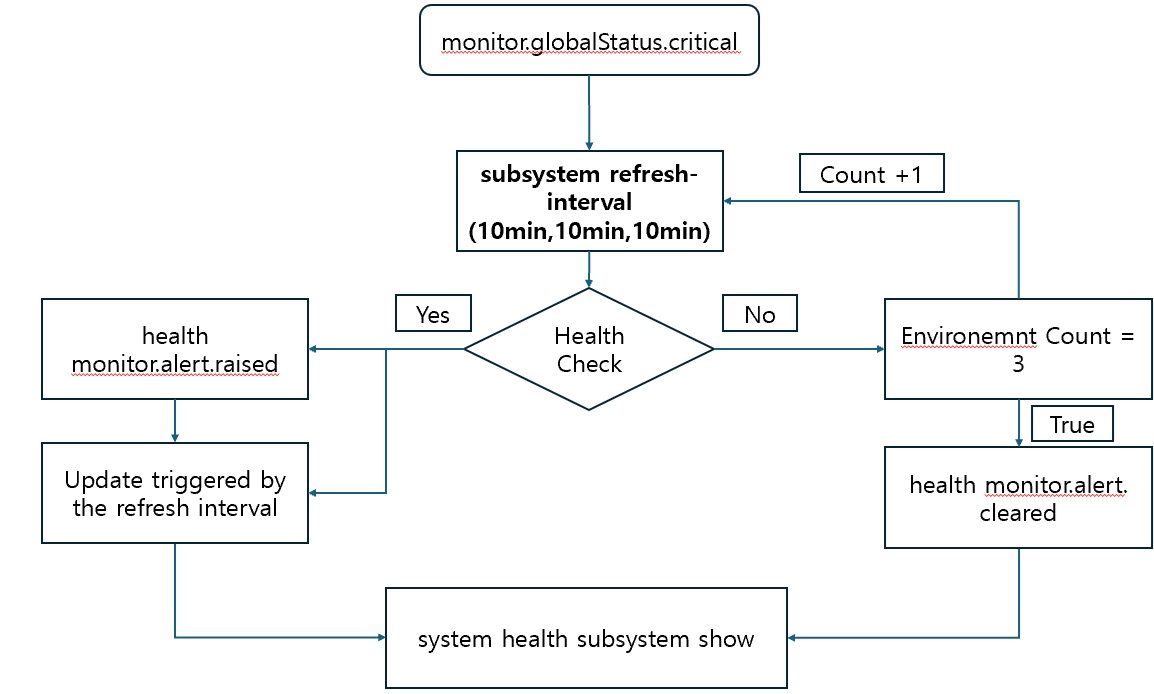
Does this mean that the system checks the state three times at 10-minute intervals before updating?
To clarify my understanding, I created an algorithm flow diagram.
I would appreciate any advice on this matter.