Earlier published experiments ran KV cache offload over pNFS with RDMA. Many enterprise environments don't have that transport available, so I wanted to see what happens on something more common.
I ran the same class of experiment on plain NFSv4.1 over TCP, without pNFS or RDMA, using a single A100. It's the kind of setup you would find in a typical enterprise datacentre.
The short version is that offload cut time to first token by 59 % at 24k tokens of context and made it 9 % worse at 8k. The crossover turned out to be somewhere I didn't expect, and working out why ended up being the most interesting part of the project.
Why this matters
When somebody sends a message to a chat assistant, the model has to read the entire conversation before it can produce the first word of its reply. That reading step is called prefill, and the working notes it produces are the KV cache.
If you keep those notes, the next turn is fast. If you throw them away, the model has to read everything again from scratch.
GPU memory is small and expensive, so the notes get thrown away often. This post looks at whether it pays to park them on storage and read them back over an ordinary NFS mount, compared with recomputing them each time.
The setup
Component | Detail |
|---|
GPU | One NVIDIA A100-SXM4-40GB |
Model | Qwen/Qwen3-8B, 32k context |
Serving | vLLM 0.28.0 with LMCache |
Storage | NetApp AFF A400, shared with other lab workloads |
Protocol | NFSv4.1 over TCP, nconnect=16, no pNFS, no RDMA |
| nconnect=16 opens sixteen parallel TCP connections, where the default is one. On this mount a single reader got 0.90 GB/s and sixteen parallel readers got 3.55 GB/s.
|
Client network | Ethernet, TCP |
Workload | 8 concurrent users, 20-round conversations |
Contexts | 8k, 16k, 24k, 28k |
Runs | 18 in total, at least two at every point |
I compared two configurations that were identical apart from one setting. The baseline recomputes prefill on every turn. The offload arm writes the KV cache to NetApp storage and reads it back on the next turn.
Result one: context length decides the outcome
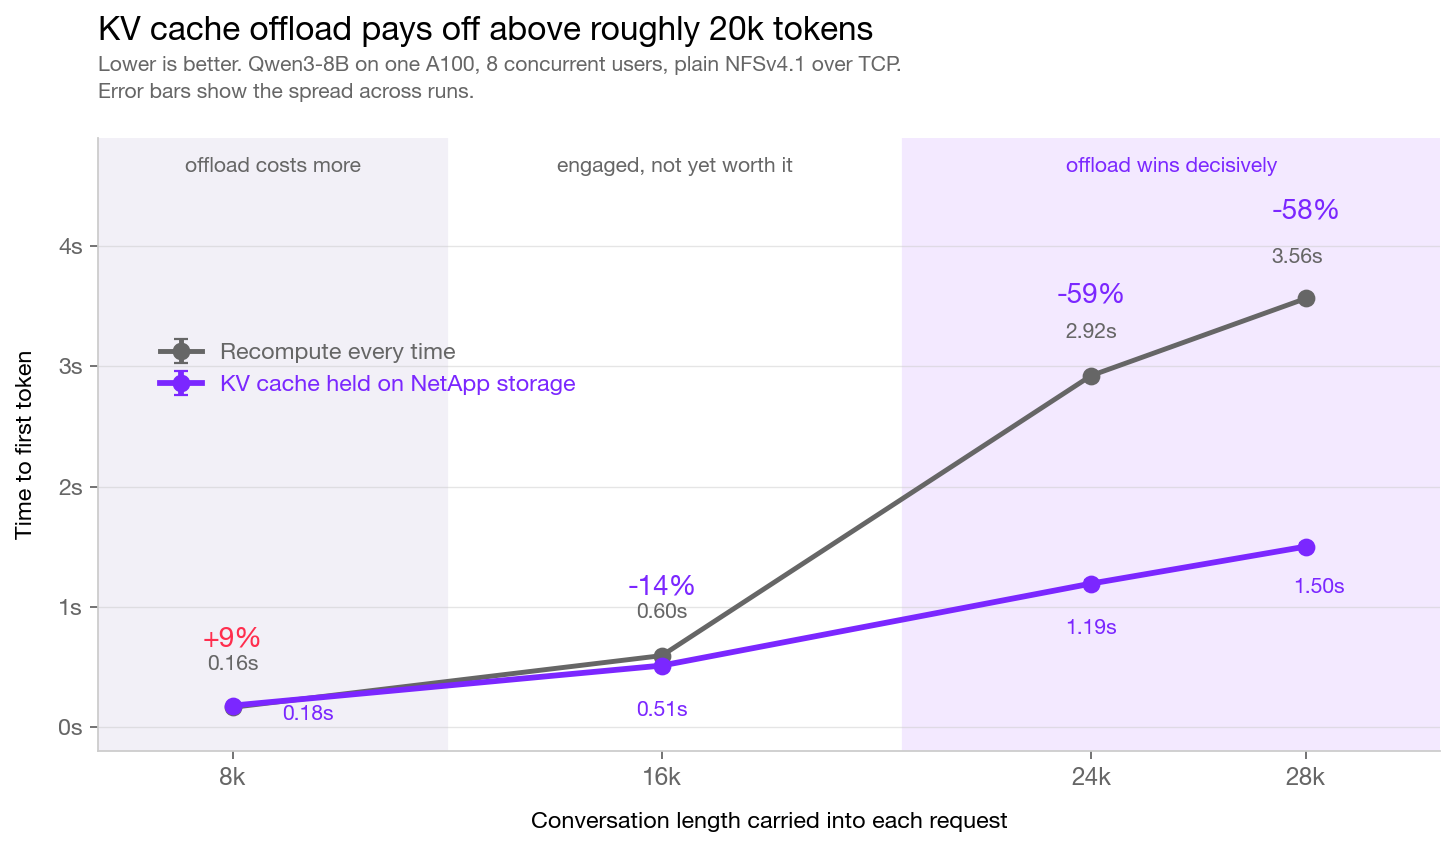
Context | Baseline | With offload | Change |
|---|
8k | 0.165 s | 0.179 s | +8.9 % |
16k | 0.595 s | 0.512 s | −13.9 % |
24k | 2.923 s | 1.194 s | −59.2 % |
28k | 3.564 s | 1.501 s | −57.9 % |
Run-to-run variation was between 0.10 and 0.39 % for the baseline and between 0.4 and 2.5 % with offload. The differences in the table are far larger than that spread, so I'm confident they are real effects.
At 24k the median request improved by 75 %, which is even better than the mean. I come back to why below.
Result two: offload can make things worse
At 8k, turning on offload added 8.9 % to time to first token. It's a small number, but it showed up consistently across runs, and the reason behind it tells you when offload isn't worth deploying.
vLLM keeps its own prefix cache in GPU memory. At 8k, eight concurrent users need about 9.7 GB of KV between them, and roughly 19 GB of GPU memory is free after the model weights are loaded. Everything fits, so the GPU never has to evict anything and serves 95 % of requests from its own cache.
The storage cache was used for exactly 0.0 % of requests. In the whole run it was never needed once.
Even so, LMCache wrote 78 GB to storage during the run, and that write traffic accounts for the whole 8.9 %. It's like paying for an insurance policy you never claim on.
Result three: the cache starts working before it starts paying off
I didn't expect this finding, and I only saw it because I added a fourth measurement point late in the project.
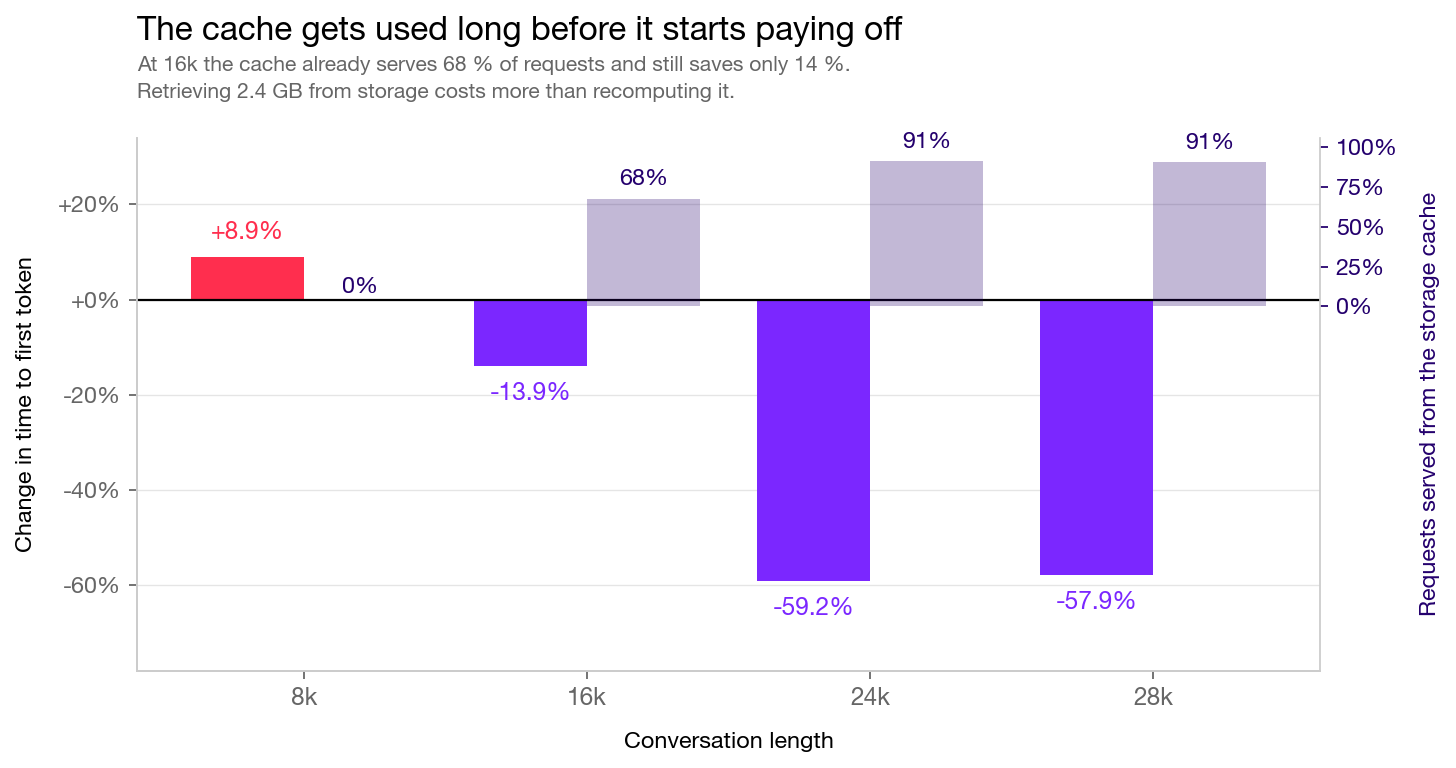
At 16k the storage cache served 68 % of requests. The GPU was evicting entries and LMCache was picking them up, which is exactly how it's designed to work. Even so, the improvement was only 13.9 %.
At 24k the cache served 91 % of requests and the improvement was 59.2 %. The hit rate went up modestly between those two points while the payoff quadrupled.
The arithmetic explains it:
Context | KV per session | Cache-hit latency at 3.55 GB/s | Baseline prefill |
|---|
16k | 2.42 GB | 0.80 s | 0.60 s |
24k | 3.69 GB | 1.16 s | 2.92 s |
At 16k, fetching the cache from storage takes 1.35× as long as recomputing it, because prefill is still cheap at that length.
So where does the 16k improvement come from? A cached entry can live in three places, and they run at very different speeds:
Tier | Size here | Roughly |
|---|
GPU memory, vLLM's own prefix cache | 19 GB free | 1,500 GB/s |
CPU memory, LMCache's local_cpu tier | 8 GB | 20 GB/s |
NetApp over NFS | 200 GB | 3.55 GB/s |
A hit counts as a hit whichever tier serves it. At 16k, eight sessions need about 19 GB between them, so the GPU is evicting, though only just. The 8 GB CPU tier is big enough to catch a good share of what falls out, and those hits come back at memory speed. The 68 % hit rate is therefore a blend of fast memory hits and slower storage hits, and that blend produces the modest 13.9 %.
By 24k each session needs 3.69 GB, so the same 8 GB CPU tier holds barely two of the eight sessions and almost everything falls through to storage. Prefill has also become expensive enough by then that a trip to storage is much cheaper than recomputing.
That gives three regimes:
- Low context (8k here). The working set fits in GPU memory, so storage is never consulted and offload only adds overhead.
- Around 16k. The GPU starts evicting and storage starts serving hits, but recomputing is still cheaper than fetching, so the gain is small.
- Above roughly 20k. Prefill is expensive enough that reading from storage wins by a wide margin.
If I had only measured 8k and 24k, I would have reported a single crossover somewhere in the middle and got the shape of the curve wrong.
The rule this gives you
The first threshold, where the cache starts being used at all, comes down to memory capacity:
concurrent_users × context_length × KV_bytes_per_token > free GPU memory
For Qwen3-8B the KV cache is 144 KB per token. On a 40 GB A100 with about 19 GB free after the weights, eight users cross that line at around 17k tokens on paper. In practice eviction starts earlier, because prompts grow during a conversation and it's the peak length that has to fit. At 16k the GPU was already evicting.
The second threshold, where offload becomes worth deploying, sits higher. On this hardware it's around 20k, and it moves with your storage bandwidth: faster storage pulls it down and slower storage pushes it up.
Both numbers are specific to this configuration. The appendix describes how to find your own.
Finding your own context length is the easy part. OpenAI-compatible servers report prompt_tokens on each response, so you can pull a week of logs and take the median and the 90th percentile. The median shows you the normal case, and the p90 shows whether long sessions happen at all.
If you haven't deployed yet, add up the system prompt, the documents you retrieve for each query and the conversation history you carry along. People tend to forget the history, and it's usually the largest part.
For a rough sense of where workloads sit:
Workload | Typical context |
|---|
Simple chatbot, short questions | 1k to 4k |
RAG over a handful of retrieved chunks | 4k to 12k |
Long RAG, many chunks or full documents | 12k to 30k |
Coding assistants carrying repository context | 20k to 100k and up |
Agentic pipelines accumulating history | 30k and up |
Coding assistants, document analysis and agent pipelines tend to sit at or above the 20k threshold, while simple chatbots sit well below it.
What the storage actually delivered
Early in the project LMCache reported a median retrieval speed of 7.49 GB/s. That's seven times the single-stream figure I had measured with dd, which made me suspicious enough to check it properly.
I ran parallel reads with O_DIRECT, which bypasses the host page cache, on real cache files. To validate the method I also ran a single-stream control on a separate set of files.
Readers | Throughput |
|---|
1 (control) | 0.90 GB/s |
16 | 3.55 GB/s |
32 | 3.74 GB/s |
The control reproduced the single-stream figure I had measured earlier, which confirmed that O_DIRECT was bypassing the cache. Going from 16 to 32 readers only added 5 %, so about 3.6 GB/s is the ceiling for this path, and nconnect=16 already reaches it.
That ceiling applies to this particular client's path to the array. I measured from a single host over TCP on a shared array, so the figure says nothing about what an AFF A400 can deliver in general.
This matters for the rest of the post. Retrieval time is KV size divided by bandwidth, so every threshold here moves with the bandwidth you can actually get. I expect faster networking or RDMA to make retrieval cheaper and move the crossover to shorter contexts, but I haven't tested that yet.
The 7.49 GB/s figure combined three tiers: the array, the host page cache and LMCache's own 8 GB memory tier. Because it mixes those together, I haven't used it anywhere in this post.
The conclusion holds with the lower figure. At 24k, loading 3.69 GB at 3.55 GB/s takes about 1.04 s, compared with 2.92 s to recompute. Storage comes out 2.8× faster using measured array bandwidth alone, with no help from any cache above it.
A model that predicts the results
Once you know your storage bandwidth, you can estimate the result on paper before buying anything. It takes two steps.
How long does a cache hit take? Divide the amount of data by your storage bandwidth, then add a little compute for the tokens that weren't cached. At 24k there is 3.69 GB of KV, which takes 1.04 s at 3.55 GB/s, plus 0.12 s of compute, so about 1.16 s in total.
What's the average across all requests? Most requests hit the cache and pay that cost, and the rest miss and pay for full prefill. At 24k, 91 % of requests hit at 1.16 s and 9 % miss at 2.92 s, so the average is 0.91 × 1.16 + 0.09 × 2.92 = 1.32 s.
hit_latency = KV_size / storage_bandwidth + compute_for_uncached
mean_TTFT   = hit_rate × hit_latency + miss_rate × baseline
You need three numbers: the size of your KV cache, your storage bandwidth and the hit rate you expect.
Context | Predicted | Measured | Error |
|---|
16k | 0.735 s | 0.512 s | 43.5 % |
24k | 1.316 s | 1.194 s | 10.3 % |
28k | 1.542 s | 1.501 s | 2.7 % |
The model is accurate above 20k and badly off at 16k, and the reason is the three-tier effect described earlier. It assumes every hit comes from the array at 3.55 GB/s. At 16k a good share of hits come from CPU memory at around 20 GB/s, so real latency is lower than the model predicts. Above 20k the working set outgrows the memory tiers, nearly every hit comes from the array, and the prediction lines up with the measurement.
I'd only rely on it for contexts above 20k.
A mistake that produced confusing results
The first two weeks of this project produced numbers that were completely wrong, and the reason turned out to be more useful than the results.
The benchmark's --qps setting controls how fast new simulated users join, and each user then sends a stream of requests. At --qps 2 users arrived so quickly that the load far exceeded what the server could handle. Its measured capacity was 0.31 requests per second, so requests piled up in a queue and average time to first token came out at 204.82 s.
Prefill at that context length takes 2.92 s, which means about 98 % of what I was measuring was time spent waiting in the queue. Offload's real saving of 1.7 s was 0.8 % of the measured number, well inside the noise. At that load there was no way to see what offload was doing.
When I dropped to --qps 0.2, which means one new user every 95 seconds and around 65 % of the server's capacity, time to first token fell from 204.82 s to 2.92 s on the same hardware and workload.
If a KV offload benchmark runs above the server's service rate, the cache effect gets buried in queueing time. A saving of a couple of seconds disappears inside a 200-second queue. If you're testing this on your own hardware, measure your service rate first and run below it. If you're reading someone else's benchmark, check what load they ran at.
How to tell whether this applies to you
Start by measuring your context length. If your working set fits in GPU memory, as it did at 8k here, KV offload won't help and may cost you a little. Your money is better spent elsewhere.
Around 16k, the gain is modest and depends on your storage. It's worth testing on your own setup before you count on it.
Above 20k, the gain is substantial. I measured 59 % at 24k on ordinary NFS over TCP. If you run long-context RAG, document analysis or agentic pipelines that carry large histories, this is worth deploying.
Concurrency matters as much as context length. The threshold depends on total live KV compared with free GPU memory, so doubling the number of users halves the threshold.
Ordinary TCP networking is enough. Every number in this post comes from plain NFSv4.1 over TCP, without pNFS or RDMA.
More bandwidth should lower the threshold. The 20k figure follows from 3.55 GB/s. By the arithmetic above, doubling usable bandwidth halves retrieval time, so I expect offload to pay off at shorter contexts on faster networking or with RDMA. I plan to measure that next.
Appendix: finding your own threshold
There are four steps.
1. Measure your service rate. Run the benchmark deliberately overloaded and read the actual requests per second from the summary. That number is your ceiling.
2. Run the real test at about 65 % of that rate. Above it you end up measuring your queue, and far below it you leave throughput unused.
3. Test at your own context length, using the figure from your logs.
4. Watch the external cache hit rate. It tells you which regime you're in before the latency numbers do. A hit rate of zero means the GPU is handling everything and offload is only adding cost.
One practical note: the benchmark harness grows the prompt every round, so in my runs the round-20 peak was 7.5× larger than the average. I sized against the average once and lost a full run when every request exceeded the model's context window. Size against the peak.
Method notes
Hardware and software
- NetApp AFF A400, all-flash, shared with other lab workloads
- One NVIDIA A100-SXM4-40GB, driver 580.82.07, in a Lenovo SR670 V2
- Ubuntu 24.04.4 LTS, kernel 6.8.0-124-generic
- vLLM 0.28.0, LMCache, Python 3.12.14
- Qwen3-8B at commit
b968826d, 144 KB of KV per token
Mount, as reported by /proc/mounts
nfs4 rw,relatime,vers=4.1,rsize=65536,wsize=65536,namlen=255,hard,
proto=tcp,nconnect=16,timeo=600,retrans=2,sec=sys,local_lock=none
pNFS was confirmed inactive (LAYOUTGET: 0). The Linux side was left at distribution defaults: read_ahead_kb 128 on every device and tcp_max_slot_table_entries 65536. Nothing was tuned for this test.
Workload
- 8 concurrent users, 20-round conversations,
--time 1200 - Load held at 63 to 71 % of each point's measured capacity, to keep requests from queueing
- LMCache tiers: 8 GB CPU, 200 GB disk
- 18 runs: three replicates at 24k and two each at 8k, 16k and 28k
- Baseline CV 0.10 to 0.39 %, offload CV 0.4 to 2.5 %
- The curve stops at 28k because the model's window is 32k and the harness adds its own growth on top of the configured context
What was controlled, and what was not
Both arms ran on the same array, mount, kernel and client, minutes apart, and only the LMCache connector changed between them. That means any settings I didn't record were the same for both arms. Background load on the shared array was outside my control, as described below.
I'm confident in the relative results, and the absolute numbers are specific to this environment. I would expect a dedicated array on faster networking to give different absolute figures and a lower crossover point, but I haven't tested that.
Comparing these results with earlier pNFS over RDMA work would mix in many differences besides transport, such as cache tier sizes, user counts and load. The cleanest way to measure what RDMA adds is to run it on this same rig and change only the mount option, which is what I plan to do next.
One run was discarded and re-run. An interrupted session had left stale entries in the cache directory, and the following run inherited them. The result was 80 % off the correct value, with a cache footprint of 78 GB against an expected 47 GB, and it still looked plausible. Check that the cache directory is empty before every offload run.