First of all... Awesome work with Netapp-Harvest \ Graphite \ Grafana! I am really enjoying this tool.
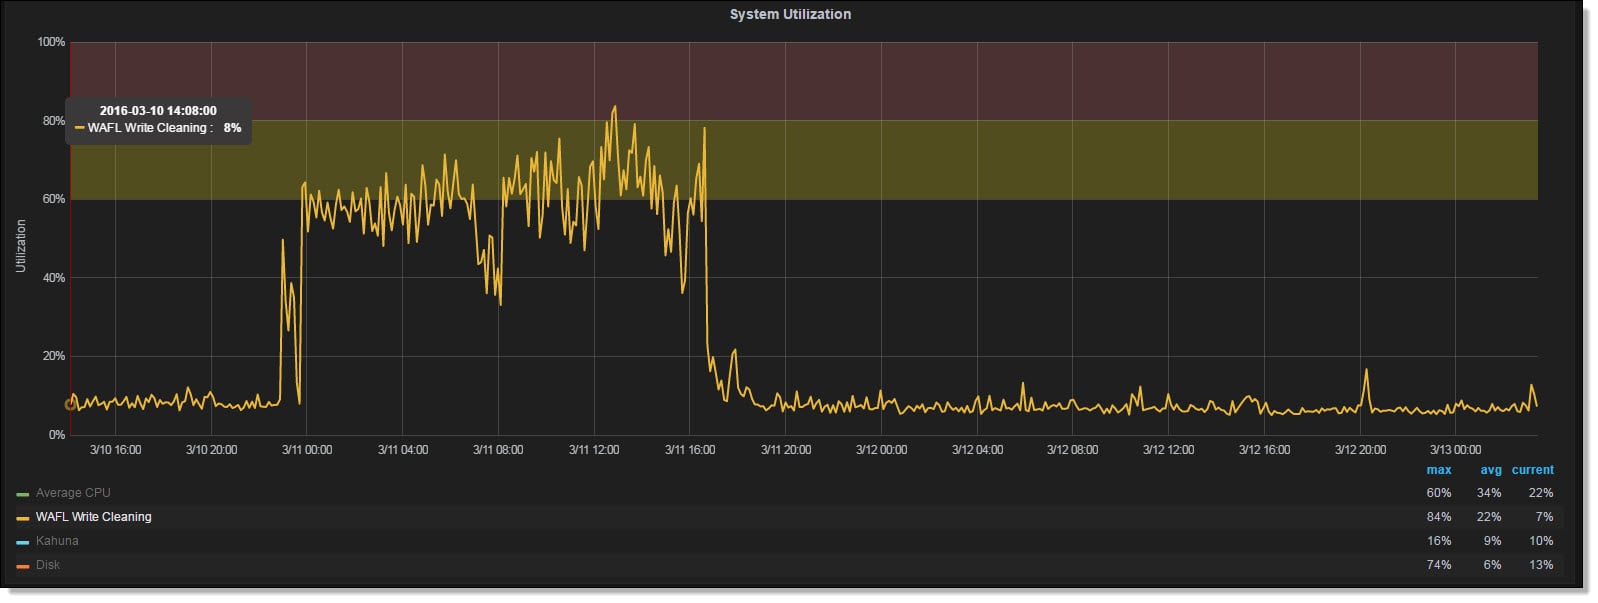
We recently had an incident where our 7-mode FAS6210 was getting heavy read latency. Ultimately we ended up executing a cluster takeover\giveback to get us out of the situation. Later we started looking at the data to see if we could determine which metrics could have been an indicator of the issue. We came across the below metric that lined up perfectly with the timing of our issue. We tried to get some additional information on what this metric was actually gathering by opening a case with Netapp. At first the support engineer stated that there was no such metic called "WAFL Write Pending". We later figured out the acutal metic was cp_phase_times\P2_FLUSH, just being aliased as "WAFL Write Pending".
The Netapp API documentation states P2_FLUSH is time taken for CP phase2 flush stage in msecs per vol.
It appears that some math and aliasing is being executed on this metric based on how I see the metric configured in Grafana (See screen shot below).
I am curious of the thought process of converting the raw data from msesc to a percentage for display in Grafana?
We would like to understand the root cause of why this metric spiked. Are there other metrics of interest to look at when "WAFL Write Pending" spikes?