About a year ago, Tech OnTap published a detailed overview of the features and functions of NetApp SANscreen®, our multivendor, multiprotocol storage management tool. Although SANscreen is typically used to optimize virtual infrastructure and provide cross-domain capacity management, in my role as a NetApp SE I've used SANscreen extensively to perform storage assessments for customers of all sizes, so I've gotten to know a lot about the tool. I've seen firsthand the advantages that SANscreen provides in a variety of complex storage environments.
In this article, I want to focus on five important reasons to use SANscreen:
- Better ability to monitor and manage capacity to mitigate risk
- Simplified chargeback
- Optimized virtual infrastructure
- Maximized savings from NetApp storage efficiency
- Improved visibility for V-Series virtualization
Most of what I discuss is applicable to most storage you've got in your environment, but the later sections also highlight some features that we've built into SANscreen particularly for NetApp storage.
Reason #1: Monitor and Manage Capacity and Mitigate Risk
If you have a variety of storage devices or protocols in your environment — HDS, EMC, NetApp, Brocade, Cisco, iSCSI, NFS, Fibre Channel, and so on — SANscreen improves visibility by providing host-to-storage access paths, storage availability, and change management. SANscreen operates out of band in near-real time. Because it requires no agents, installation is simple and nondisruptive. SANscreen continuously discovers storage device information — including configuration, volumes, mapping, security, and network protocols — to provide a single-pane-of-glass view of your entire storage environment.
You define policies based on parameters such as protection, sharing, utilization, and interfaces. Changes are validated against this service model to determine whether any policy violations exist that could lead to service quality issues or actual outages. As a result, you are able to minimize and mitigate risks.
Capacity management is improved by flexible reporting that supports trending and historical usage, forecasting, capacity planning, purchasing, storage tier analysis, and chargeback. You can group and view this information by any logical unit that makes sense such as by data center, business unit, application, tier, and so on.
Detecting Vulnerabilities and Mitigating Risk
SANscreen makes it easy to detect vulnerabilities, such as when a volume is approaching overcapacity. SANscreen helps you manage these vulnerabilities by letting you set thresholds for things like thin provisioning with exception reports that allow you to look at a group of storage devices and quickly see the total allocated and committed capacity. If a volume has been thin provisioned you can set thresholds and immediately see if it is overcommitted — that is, if you've allocated more space within the aggregate or storage pool than you actually have. Vulnerabilities are indicated whenever set thresholds are crossed.
For each storage pool, SANscreen can determine when unused capacity drops below a set cutoff and generate an exception report showing you only the storage pools that are affected. For thin-provisioned storage pools, this threshold default would normally be 10%; there is also an overcommit threshold for thinly provisioned storage pools that defaults to 150%.
SANscreen also monitors and signals violations and vulnerabilities on a broad range of factors such as connectivity, masking, mapping and zoning, port usage, and orphaned storage.
Capacity Trending
In addition to identifying immediate capacity-related vulnerabilities, SANscreen provides trending that can show you how much storage you've got at each particular service level and predict how much you're likely to need in the next period.
Figure 1) Historical information collected in the SANscreen data warehouse can be used to forecast when each storage tier will reach its used capacity threshold in each data center.
Reason #2: Simplifies Chargeback
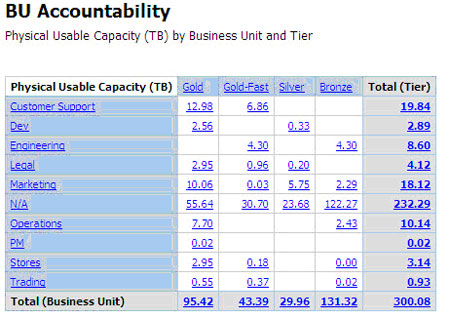
Most organizations are likely to have multiple business units such as Legal, Development, Marketing, Operations, HR, and so on. Each of these may have its own storage, servers, and applications with SLAs for performance. SANscreen lets you understand each group's capacity and utilization and annotate the environment in detail by assigning labels that identify a specific business unit's storage, tiering, and service paths. As a result, you can immediately see how much storage each business unit has used in each storage tier over a given period of time. This detailed information allows IT and business units to work together to make more intelligent decisions about how storage is used. In addition, ongoing monitoring can enable defined SLAs for each business unit to be met.
Figure 2) SANscreen lets you define specific tiers or levels of storage. Because service paths for each business unit are identified, SANscreen can determine how much capacity a business unit is using in each tier for charge-back purposes.
Reason #3: Optimizes Virtual Infrastructure
Once you've achieved the initial efficiency gains from virtualization, reaching the next level of efficiency gains and cost reductions can be a lot more challenging.
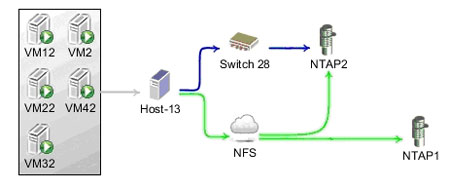
SANscreen has the ability to provide a global view of the end-to-end service paths used by your virtual infrastructure, for SAN protocols and NFS. SANscreen provides monitoring and reporting across your virtualized infrastructure and can even map host paths to specific NFS resources.
Figure 3) Mapping VMs to specific storage resources.
SANscreen can help you load balance on both virtual and physical infrastructure. It makes it easy to identify idle/stale VMs and VMs with overallocated storage to keep VM sprawl at bay.
Reason #4: Maximizes Savings from NetApp Storage Efficiency
For the most part I've focused on features that pertain to heterogeneous storage up to this point, but SANscreen has also added significant functionality to monitor unique features of NetApp storage. In fact, there's a NetApp-only licensed version of SANscreen that is available for all-NetApp shops that have up to 600TB of capacity.
Many IT shops are cautious about introducing change into their production environments, and that's sometimes true with storage efficiency features like deduplication, thin provisioning, and FlexClone®. SANscreen can help you better monitor these features to maximize usage.
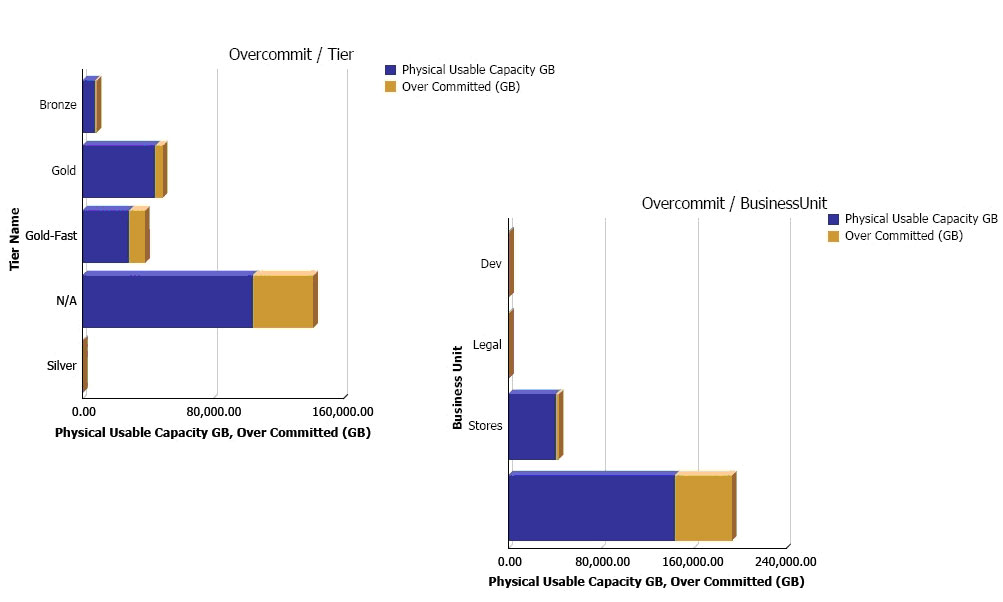
For example, SANscreen shows you how much you are overcommitted on thin provisioning at the device/storage pool level and the business level, allowing you to better manage thin-provisioned capacity.
Figure 4) Overcommit reporting by tier and business unit.
For thin provisioning, SANscreen lets you look across all your systems to see how overcommitted you are and alerts you when thresholds are exceeded. You can also see which volumes have NetApp deduplication running on them, and the space you're saving as a result. For each volume that is a FlexClone volume of another volume, SANscreen can tell you from where it was cloned and how much of the clone is still shared with the source volume.
Reason #5: Improves Visibility for V-Series
The ability to visualize service paths in NetApp V-Series environments is another big SANscreen advantage. The V-Series is designed to serve as a front end to third-party storage, bringing the full NetApp feature set to other vendors' storage. SANscreen lets you see the full service path from the host to the V-Series controller to the aggregate to the virtual LUN and all the way down to the full details of the physical disk volumes on the back-end array.
Figure 5) Three views of V-Series storage virtualization.
Figure 5 is a SANscreen visualization that shows three different topology views for a FC-attached host. Specific information such as WWNs and port numbers can be shown in a "details" view for each of the device connections.
- The upper-left topology shows that there are two HBA connections from the host to the FC switch, and four connections from the switch to the V-Series controller. Though there are four FC connections from the switch to the V-Series, only two show a green connection that indicates that zoning and masking are correct.
- The lower-left topology shows that there are two connections from the V-Series controller to the FC switch, and two connections from the switch to the CLARiiON back-end storage. Each of the connections is green, indicating all paths are correctly configured.
- The topology to the right shows that the LUN (LUN1) mounted on the client has been created on a FlexVol® volume (vol1clariion) on the V-Series, which has been created on an aggregate (on the V-Series) of virtual disks (made up of back-end volumes 0, 1, and 2) on the CLARiiON array.
Conclusion
If your storage environment and virtual infrastructure have become too complex for you to manage, SANscreen may be the solution. By helping you plan and map your current and future storage environment, SANscreen can reduce your capital and operational expenses while enabling higher levels of service. SANscreen simply gives you better information about your storage environment and how it integrates with your servers and VMs. Better information leads to better decisions and improved operations.
 | Mark Conahan
System Engineer Team Lead
NetApp Mark is the team lead for the inside system engineers within the NetApp SANscreen Business Unit. He is involved in SANscreen demonstrations and troubleshooting, and regularly uses the tool in the field for presales storage assessments. Mark has over 13 years of industry experience, including 3 years at Brocade and 9 years at SGI. |


