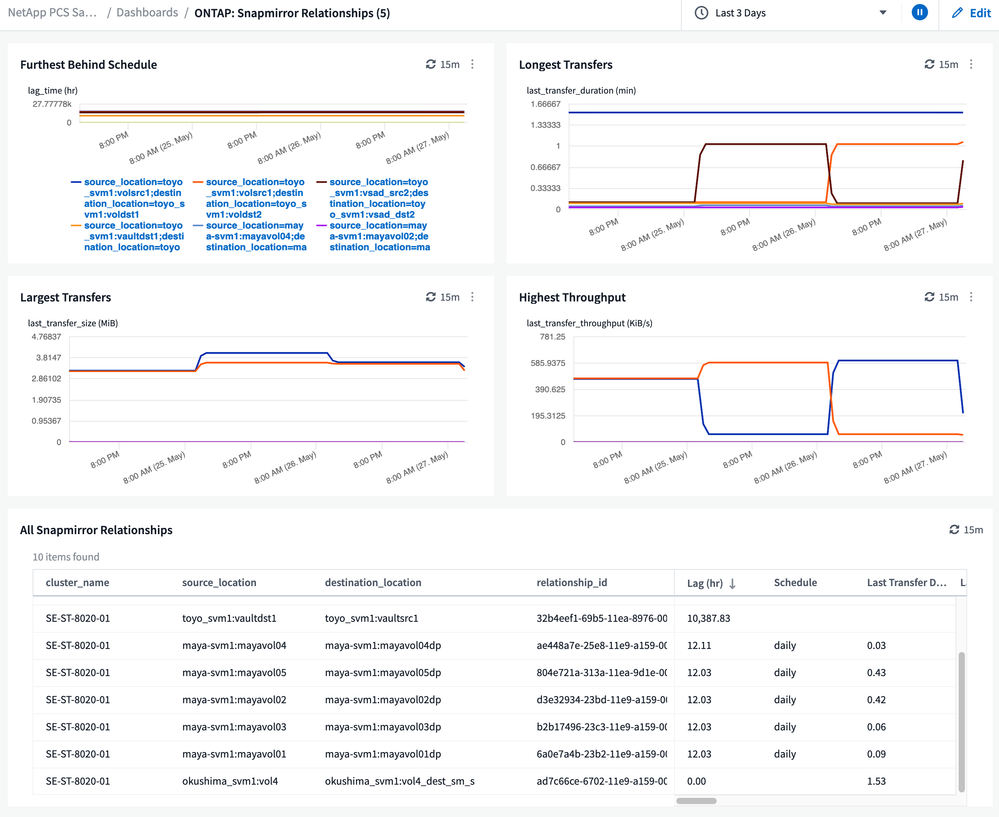
ONTAP SnapMirror replication has evolved over the years into an incredibly powerful tool for data protection and storage efficiency. Of course with great power, comes great responsibility, and a robust data protection strategy relies on being able to easily keep track of these relationships. To that end, we've added SnapMirror relationship monitoring capabilities to Cloud Insights via the ONTAP collector. If you're already monitoring ONTAP in Cloud Insights, getting started couldn't be easier. Just navigate to the dashboard gallery and select the new SnapMirror Relationships dashboard to automatically add it to your tenant.

Once added, you can view the dashboard and customize it to your hearts content (don't worry, you can always add it again if you make a change you decide you don't like later). We collect a total of 12 metrics measuring lag times, throughput, bytes transferred and success / failure counts. Each metric is has approximately 20 attributes added to it indicating SnapMirror replication status and configuration. Oh, and if you see nothing in the dashboard, the collector advanced metrics check box may be .... unchecked. Set that and wait an hour to start seeing metrics.

This dashboard enables a number of data protection use cases :
- Tracking and troubleshooting specific replication relationships
- Analyzing a cluster's whole replication health
- Correlating replication workload with other application workloads
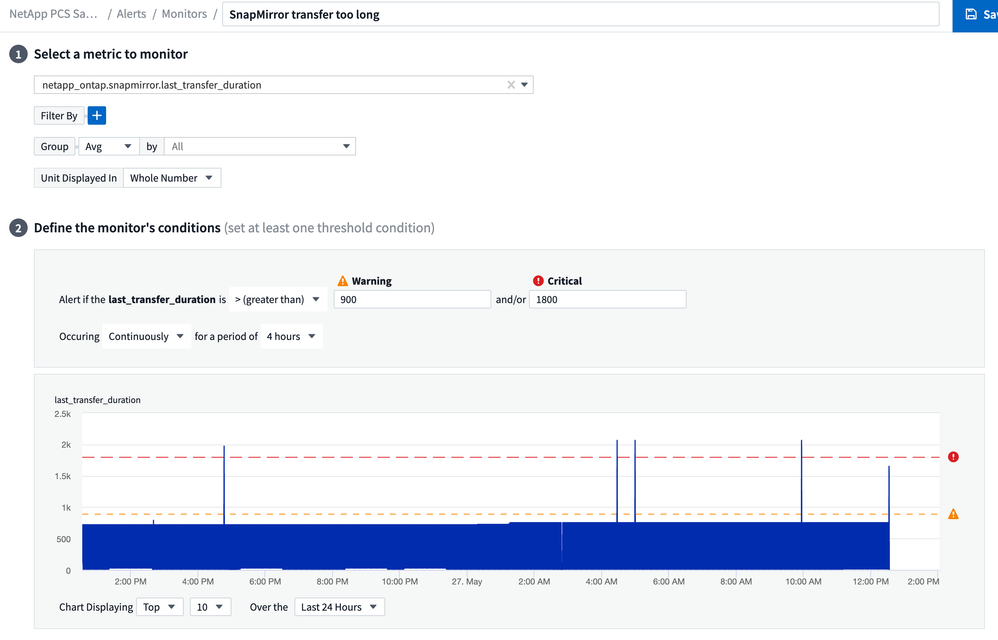
A monitor can be created to alert you when a metric goes beyond nominal range - for example, would you like to get warned if a replication takes more than 15 minutes to complete? Easy:

Typical items to monitor and track for SnapMirror include -
- Consistently failing replications - if you see metric netapp_ontap.snapmirror.total_failed_count go higher than zero consistently over a few hours, time to explore potential networking issues
- Size of largest transfer - if you see metric netapp_ontap.snapmirror.last_transfer_size change size significantly, your workload characteristics have changed and you may want to check that application
- Table with all SnapMirror relationships in your environment - you can sort by any attribute, such as failed relationships or show me the realtionships furthest behind. That will help you focus on which part of your infrastructure needs attention.
What do you envision using this data for in your environment? Have you customized your own version and want to share? Do tell! Questions or clarifications? Post a comment and we will respond.