Network and Storage Protocols
- Home
- :
- ONTAP, AFF, and FAS
- :
- Network and Storage Protocols
- :
- Re: Monitoring NetApp
Network and Storage Protocols
- Subscribe to RSS Feed
- Mark Topic as New
- Mark Topic as Read
- Float this Topic for Current User
- Bookmark
- Subscribe
- Mute
- Printer Friendly Page
- Mark as New
- Bookmark
- Subscribe
- Mute
- Subscribe to RSS Feed
- Permalink
- Report Inappropriate Content
I'm running a FAS2020 with DataONTap 7.2.4. I'm running into some
performance hiccups and wanted to take a look at what my options are to monitor my SAN. I've looked a bit through the MIB list for SNMP but am having a hard time discerning what I should be looking at to determine performance issues.
Additionally, can someone please help explain what some of the sysstat information is? What are the implications of cache age and cache hit? What about the CP Time?
Appreciate the help!
Manu
- Mark as New
- Bookmark
- Subscribe
- Mute
- Subscribe to RSS Feed
- Permalink
- Report Inappropriate Content
Hi Manu,
The following link should help you to start looking into the stats monitoring.
CP page https://now.netapp.com/Knowledgebase/solutionarea.asp?id=kb23471
systat man http://now.netapp.com/NOW/knowledge/docs/ontap/rel73_vs/html/ontap/cmdref/man1/na_sysstat.1.htm
Chris Blog about stats
Thanks;
Daniel
- Mark as New
- Bookmark
- Subscribe
- Mute
- Subscribe to RSS Feed
- Permalink
- Report Inappropriate Content
Fantastic links. I'll read through those and then post any follow ups. But appreciate it.
- Mark as New
- Bookmark
- Subscribe
- Mute
- Subscribe to RSS Feed
- Permalink
- Report Inappropriate Content
There are really only a few things that can affect performance of NetApps - CPU load, and disk load.
Assuming you want to track this info over time, and graphically, and not just use CLI tools:
CPU load is available by snmp. The consistency point statistics (also available by snmp) are secondary indicators of CPU load and write activity.
Cache age isn't very actionable by itself - it can be a starting point to see if your workload would benefit from a PAM card.
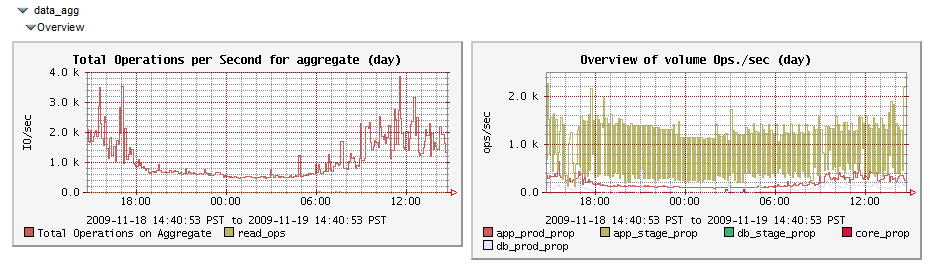
Disk load is an issue as it affects latency - so what you really want to track is latency of read/write requests per volume. And ideally, have information about which volumes are on the same aggregate, as they are the ones that can impact each other.
So if there is a performance issue caused by read or write request latency, you want to see which volumes on that aggregate had unusual operation load. Or track disk utilization for that aggregate, to see if you need to add more spindles, or migrate volumes.
Unfortunately, volume performance info is not available by snmp. You can use the SDK to get this information (http://communities.netapp.com/docs/DOC-1110), and there are various scripts floating around that can help.
CPU is .1.3.6.1.4.1.789.1.2.2.2.0
Also useful to track is operations per protocol (such as NFS Ops - .1.3.6.1.4.1.789.1.2.2.6.0; CIFs ops - .1.3.6.1.4.1.789.1.2.2.8.0)
But the more useful volume latency, operations, throughput, etc are not there in snmp.
If you dont want to build/manage your own monitoring system, check out LogicMonitor.com which automates all the above monitoring with no configuration required..
- Mark as New
- Bookmark
- Subscribe
- Mute
- Subscribe to RSS Feed
- Permalink
- Report Inappropriate Content
After a long time of searching for information why I can't get nfs statistics, I found out that the nfs, cifs, cache and other snmp-information are only available in 7-Mode but not in clustered ONTAP !
Detailed information you find in https://www.netapp.com/us/media/tr-4220.pdf
- Mark as New
- Bookmark
- Subscribe
- Mute
- Subscribe to RSS Feed
- Permalink
- Report Inappropriate Content
You might also check with your NetApp sales team/reseller to see if you might be able to get Operations Manager (specifically the included Performance Advisor piece).
- Mark as New
- Bookmark
- Subscribe
- Mute
- Subscribe to RSS Feed
- Permalink
- Report Inappropriate Content
Consider also using Nagios for NetApp-minitoring. There are a lot of free plugins around plus a commercial and complete suite of Nagios-Plugins for NetApp, which can monitor (alert and trending) nearly any aspect from volumes-usage to latency.
Cheers, Ingo
- Mark as New
- Bookmark
- Subscribe
- Mute
- Subscribe to RSS Feed
- Permalink
- Report Inappropriate Content
Hi Manu
Pls check the following link:
https://www.manageengine.com/products/opstor/monitoring-netapp-fas.html
Though, i have not used this product, it looks good......
