Successful operations teams monitor their services to identify issues before they escalate. The key is to monitor critical resources and to check on whether they are operating within healthy boundaries. Google Cloud Monitoring enables administrators to monitor key Google Cloud NetApp Volumes metrics and to create proactive notifications if those metrics reach certain thresholds.
Cloud Monitoring
Google Cloud Monitoring is the central service in Google Cloud to aggregate metrics, to visualize them in charts, and to create alerts to send notifications if certain thresholds are exceeded.
In my recent Monitoring NetApp Volumes blog post, I discussed how Cloud Monitoring can be used to create useful charts about NetApp Volumes metrics and how to aggregate multiple charts into a dashboard. Now we will go one step further and use Cloud Monitoring to set up alerts that create incidents if a metric breaches a given threshold. Such incidents can trigger different kinds of notifications by using notification channels.
The most common metric that NetApp Volumes administrators want to monitor is the amount of space left in a volume. Users and/or applications receive out-of-space errors when writing beyond a volume’s capacity. A typical use case is to monitor the volume usage and to set a threshold at 80% full. Let’s take that metric to run through the workflow of setting up an alert.
Alerts
First, we need to create an alert. The best practices dashboard already contains a chart for volume usage, which tells us how full the volume is with a percentage value from 0% (empty) to 100% (full). We extract the existing PromQL query from the Volume Capacity Usage chart by clicking the small pencil and by copying and pasting the chart into the Create alerting policy page.
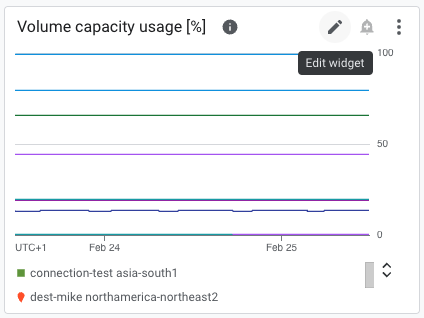
Because we want to trigger our alert if usage goes beyond 80%, we add “> 80” as a condition to the PromQL query:
netapp_googleapis_com:volume_bytes_used / netapp_googleapis_com:volume_allocated_bytes * 100 > 80
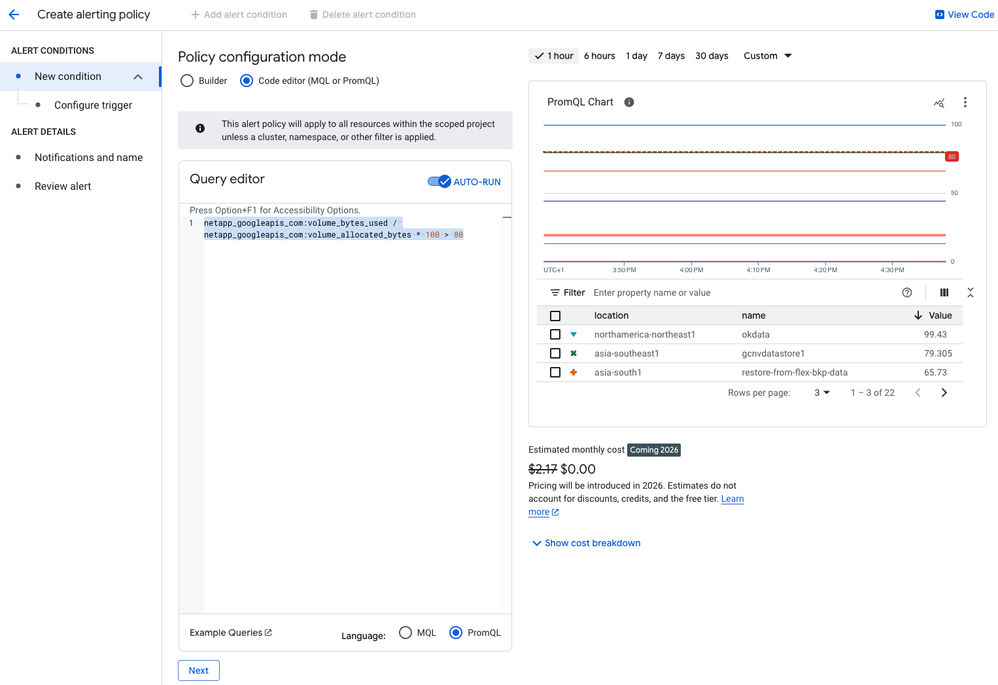
The preceding screenshot shows an example environment. In the preview chart and table, you can see that the volume okdata is already beyond 80%, and the volume gcnvdatastore1 is very close to the 80% threshold.
Clicking Next sends us to the next page, which allows us to refine the trigger condition.
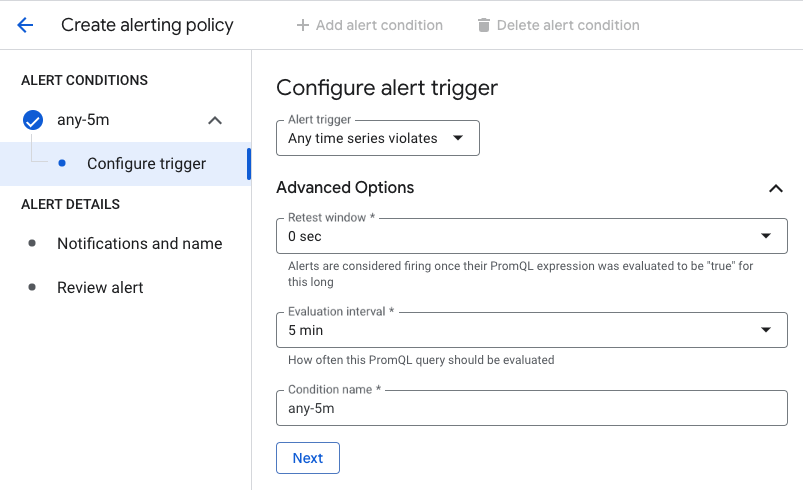
For our purposes, we choose Any Time Series Violates as the alert trigger, because each time series represents the usage of a volume and we want to trigger an alert if any volume usage goes above 80%.
We want to fire the alert immediately after our condition is met, so we use a retest window of 0 seconds. Because Google Cloud NetApp Volumes sends metrics to Cloud Monitoring every 5 minutes, we choose 5 minutes as the evaluation interval.
Finally, we give the condition resource a name. Let’s pick “any-5m” and click Next. We have now specified everything that the alerting policy needs to trigger incidents. But an incident that nobody knows about is useless. So, let’s tell Cloud Monitoring to notify us about incidents.
Notification channels
When an incident is triggered, Cloud Monitoring can send a notification through multiple user-defined notification channels. Notification channels can be of multiple types. An email to a person can be a channel. An SMS to a mobile phone can be a channel. A message to PagerDuty or a generic webhook can be a channel. The possibilities are plentiful.
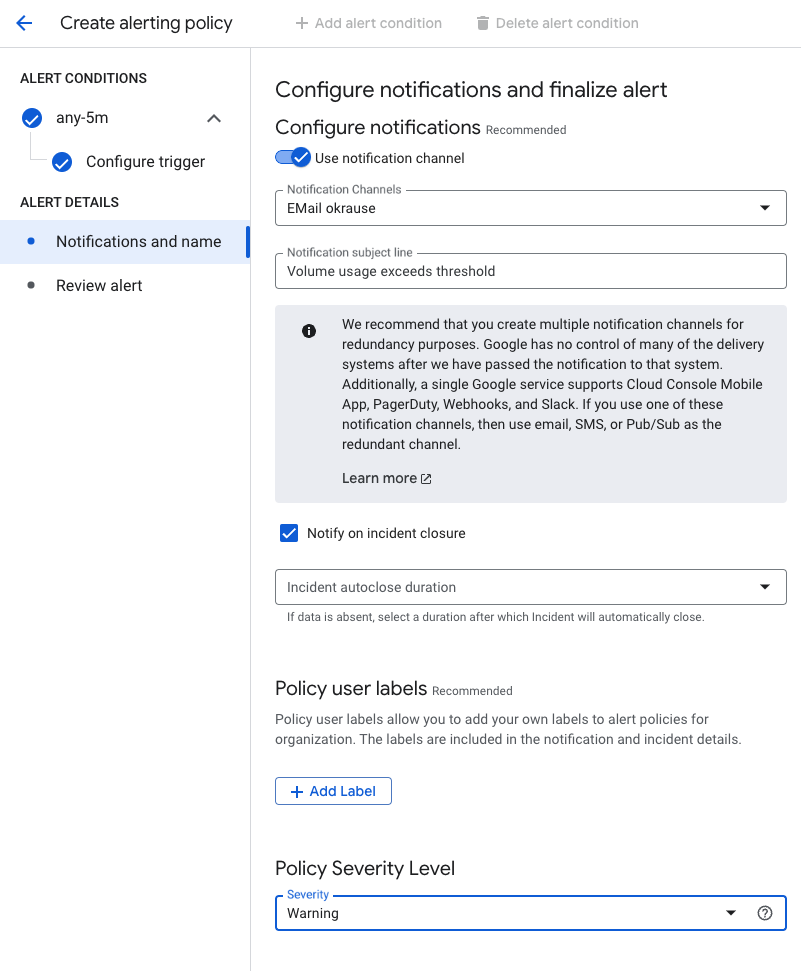
For our example, we choose email as our notification channel, and we add a specific subject line that helps us differentiate this incident from others. We also opt to be notified if the problem is resolved; for example, when a colleague increases the volume size. For the severity level, we consider this incident a warning. Our volume threshold is set to 80%, so we have plenty of time to react.
After giving the policy a good name, we can click Next to get a summary of our settings and then click Create Policy to finally create this policy.
Incidents
With the alerting policy active, we now get our first incident notification. As we saw previously, the volume okdata is close to 100% usage. Within 5 minutes, the alert policy fires and creates an incident. Because we configured an email notification channel, we receive an email (in the spam folder, but that’s a different issue).
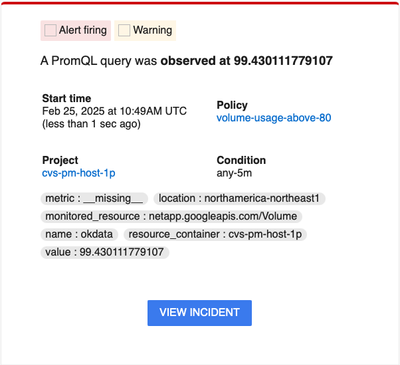
We click the View Incident button, which sends us to the Incident details page in the Google Cloud Console.
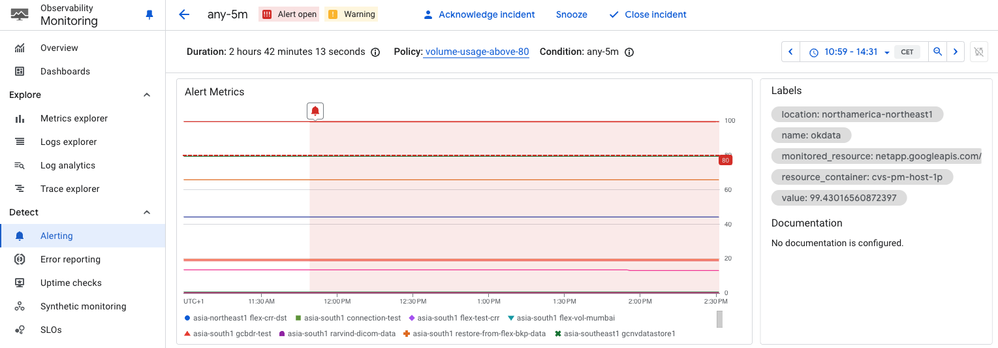
This page shows all the relevant data, such as volume name, location, and project, similar to the email that we received. We have all the information that we need to remedy the issue. We can open the volume page of Google Cloud NetApp Volumes and increase the volume size so that we have more than 20% of available space.
After increasing the volume size and waiting for a few minutes, we are notified that the incident was closed because the cause was resolved.
Next steps
Alerting in Google Cloud Monitoring is a bit complex to set up, but it’s very powerful. You can use the approach that I described in this blog post to set up multiple alerts for all kinds of criteria. As a minimum setting for Google Cloud NetApp Volumes, I recommend that you go with volume usage and inode usage monitoring.
The PromQL queries that you can use are:
# Volume usage
netapp_googleapis_com:volume_bytes_used / netapp_googleapis_com:volume_allocated_bytes * 100 > 80

# Inode usage
netapp_googleapis_com:volume_inode_used / netapp_googleapis_com:volume_inode_limit * 100 > 80
Happy monitoring!
If you found this blog post to be useful, please give it a thumbs-up. If you would like to see example Terraform code for setting up alerts, please let me know in a comment. If I get enough requests, I may invest the time to create it.