Cloud Insights is NetApp’s one-stop shop for hybrid-cloud dashboard visualization, helping customers monitor, analyze, troubleshoot, and secure their infrastructure and applications. Able to consolidate metrics from hundreds of unique data sources, Cloud Insights brings observability to an organization’s entire on-site and cloud infrastructure. To increase ease of use and to save StorageGRID customers time and effort, Cloud Insights has added four NetApp® StorageGRID® dashboards to the gallery. These dashboards provide valuable StorageGRID visualization out of the box.
StorageGRID is NetApp’s software-defined object storage suite, regularly deployed in hybrid-cloud environments to bring object storage to the on-premises data center. The new StorageGRID Cloud Insights gallery dashboard templates—Capacity Summary, ILM Performance Monitoring, Metadata Usage, and S3 Performance Monitoring—allow StorageGRID administrators to keep up with their grid’s condition in real time. These templates can be copied and customized or used as is.
The Capacity Summary dashboard contains a breakdown of total grid space, free space, and used space, as well as storage usage per node, tenant, and bucket. This comprehensive overview of storage capacity allows administrators to monitor their grid’s usage from a single location. Service providers will find the per-bucket and per-tenant capacity view especially useful because they may need to keep track of hundreds of tenants and buckets. This dashboard ranks bucket and tenant usage, making it easy to track who is using the most storage.

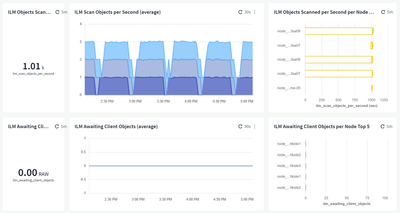
The ILM Performance Monitoring dashboard contains several key metrics for tracking the grid’s information lifecycle management engine, the engine responsible for ensuring objects are compliant with administrator-set policies like erasure coding, site distribution, cloud tiering, and more. This dashboard covers the ILM engine’s average objects scanned per second and the average number of clients awaiting ILM processing.

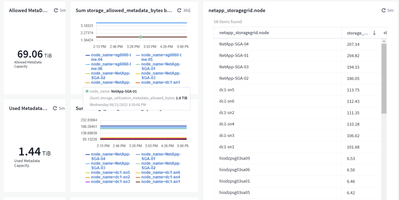
The Metadata Usage dashboard tracks the grid’s metadata utilization, an important metric that affects the number of objects the grid can store. This dashboard displays the total, available, and used metadata space for the entire grid and per node, as well as the 7-day trend of metadata use percentage per node.

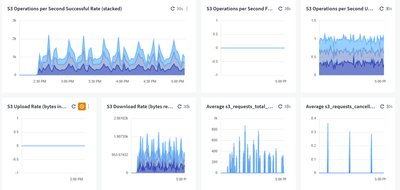
The S3 Performance Monitoring dashboard tracks incoming S3 requests, making it easy for grid administrators to understand their grid’s current S3 workload at a glance. This dashboard displays successful S3 operations per second, as well as download and upload rates per node. It also tracks failed and unauthorized operations.

Check out these new dashboards now on Cloud Insights.