ONTAP Essentials: Data Protection Dashboard
Even if setup correctly, data protection policies can run into issues as time marches on: replication links can become overloaded and bog down, capacity can dwindle. Ensuring that volumes are sufficiently replicated and have sufficient snapshot granularity to meet recovery point objectives is an important part of any data protection strategy. Cloud Insights: ONTAP Essentials helps both validate your data protection health, and monitors data protection problems as they happen. Lets take a deep dive into how that works. As a reminder, Cloud Insights: ONTAP Essentials is included with your advantage support agreement. For more information about getting started with Cloud Insights check out our earlier posts in this series.

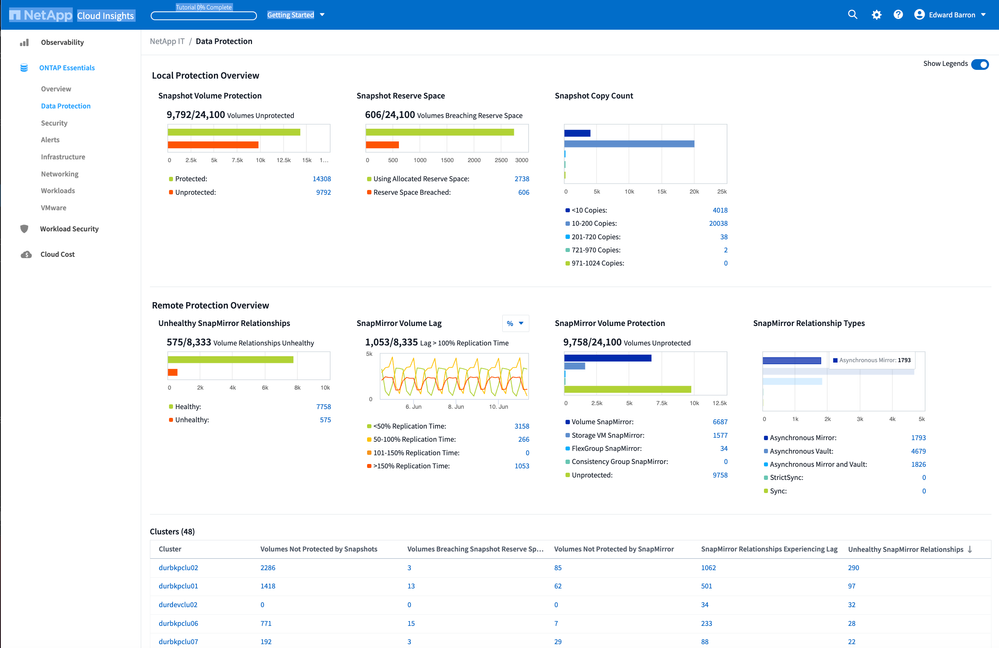
Under ONTAP Essentials, using the left hand navigation, select: Data Protection->Summary to access. The dashboard itself is broken into 3 sections:
- Local - Focusing on local snapshot health and recovery points.
- Remote - Replication health, usage and relationship types.
- Cluster DP Summary - A per cluster summary of any concerns noted in local and remote section above.
Pro Tip: Once you're familiar with the dashboard, you can turn off the legends, and shrink up the screen for a tighter display.
Local Protection
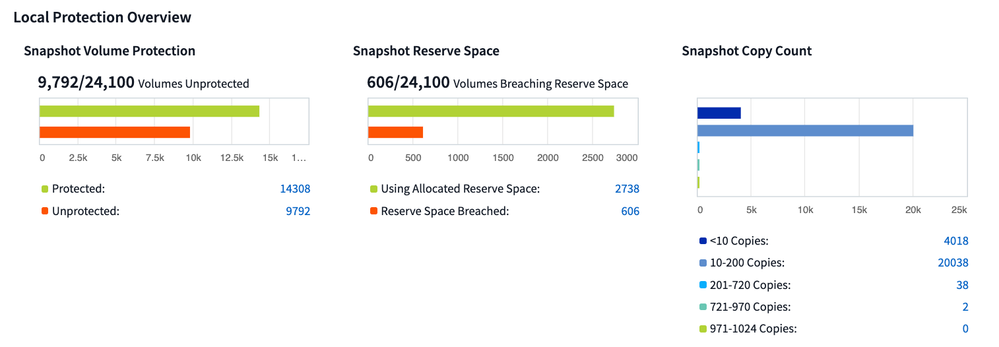
Local protection refers to Snapshots and their health. We have three cards here, the first of which focuses on helping us understand which volumes are protected and which ones are not. Like most dashboards in ONTAP Essentials, clicking on the numbers will take you to a drill down view, so clicking on the unprotected volume count will allow you to review the volumes that are not protected and validate that they are non-critical data.

Snapshot reserve is the space used to store snapshot data within the volume. Volumes that don't take snapshots don't use this space. Be sure these volumes are not allocating snapshot reserve. If so you're wasting space. For volumes with snapshots we want to keep an eye on reserve consumption. If the snapshot data starts to exceed (breach) the allocated reserve space it eats into the volume space and adjusting the volumes size or reserve space might be appropriate to ensure space guarantees are met. Clicking on the count will take you to the breaching volumes.
Snapshot Copy Count is about granularity. Are there sufficient recovery points for my volumes? Too few and you may not have sufficient recovery points. Too many and you may be expiring old snapshots prematurely. Keep an eye on both ends of the count.
Remote Protection
The remote protection cards track replication of your volume data from the local cluster to a remote one. When looking at remote replication we're really looking at 3 things. Is the remote replication healthy (first card)? Are our replication links keeping up (second card)? And what are the types of remote replication are we using, are we configured to use best practices (3rd and 4th cards)?
Our first card talks about health. Again, clicking through to the details page will let us better understand why the volume replication relationship is unhealthy - this could be anything from a broken mirror to other replication link problems.

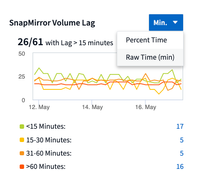
Our second card, SnapMirror Volume Lag, looks at replication two different ways, the default view, lag by %age shows lag as a function of snapshot schedule. Here we're trying to validate that each snapshot is replicated before the next snapshot is taken. We want to avoid back to back, or worse snapshot replications queuing up because the previous snapshot hasn't replicated. Anything over 100% replication lag is a problem.
We can also view replication as a function of absolute time. So if we want to know how many of our volumes have a recovery point of >5 minutes, selecting Raw Time will help.

The last two cards document the kinds of remote replication relationships we have, or if we have no remote relationship at all. For example is our replication policy defined at the volume or SVM level? And finally is our replication synchronous, asynchronous, are we vaulting? These cards can help us quickly identify which volumes are following which of our org's backup policies, very useful in reporting or for identifying outliers.
Cluster Summary
Because the top half of the Data Protection dashboard is datacenter wide, we breakout summary data on a per cluster basis on the bottom. Each column identifies the count of volumes that may be experiencing an issue worth looking into as described above. Similar to the legends, clicking the numbers will take you to a filtered detail view.

Data Protection Monitoring
The dashboard gives us a great summary of where sit with our data protection policies, but you don't have to login and check the dashboard to be informed of data protection issues. Cloud Insights can monitor and alert on these conditions as well. Cloud Insights doesn't turn workload level alerting on by default. To enable, goto the ONTAP Workload Examples monitor group, found in the Observability menu under Alerts->Manage Monitors. You can filter the list of examples down using the search function, for example, search for 'snapshot' or 'mirror'.

Before enabling, be aware of scope. Enabling may enable for all volumes on all clusters. Cloud Insights basic edition users can have up to 5 custom monitors, if you wish to copy the monitor and customize its scope to a single volume or cluster. If you're looking to receive notifications via email or other mechanisms, make sure to enable those too.
Thanks for looking at ONTAP Essentials data protection monitoring. As always, please leave feedback in the comments. ONTAP Essentials and all of NetApp's products get better when you participate. We want to hear from you.