In the decades since the advent of shared enterprise storage, technology has moved on leaps and bounds. But one thing has remained consistent: whenever there’s a performance issue with a service or application, somehow, some way, it’s probably the storage team’s fault.
There was once some truth to this - spinning disks have historically been the weakest link of the performance chain and it was all too common that specific RAID groups or even entire arrays would become overwhelmed with I/O, leading to performance saturation that was felt far and wide by dozens of other applications sharing the same storage system.
Now that all-flash storage systems have become the norm, this is ancient history. Despite this leap in performance, the storage team often remains as the first to be scrutinized when application performance issues arise.
The modern storage landscape
All-flash arrays have significantly reduced the likelihood that storage is the root cause of performance issues. The latest AFF and ASA systems for example can handle vast amounts of IOPS all while providing sub-millisecond latency, more than capable of meeting the demands of modern applications. However, the legacy of storage blame often persists, overshadowing the real culprits: changes within the infrastructure.
Analysts estimate that 85% of infrastructure incidents are caused not by hardware failure or performance saturation, but by configuration changes somewhere in the data path. So, when application issues arise, storage teams need a rapid way to identify not only that the storage systems are healthy, but also to identify any changes in the data path that may have led to the issue.
How long it takes to identify the root cause is the “Mean-time-to-Innocence” (MTTI) for most, because as soon as the component at fault has been identified, the relevant SME can get to fixing it whilst everyone else gets back to their day jobs.
Reducing the MTTI is also where the most significant savings can be made on overall Mean time to resolution (MTTR). Consider an incident as a timeline: first an issue is detected with an application, some time passes before teams can identify the cause, and then some more time passes before the relevant SMEs are able to correct the issue.
The second half of this timeline is experts addressing a now-known issue, so doing it quicker would mean putting more expertise on the problem – easier said than done. This leaves the first half of that timeline with the most room for optimization.
Enter Data Infrastructure Insights
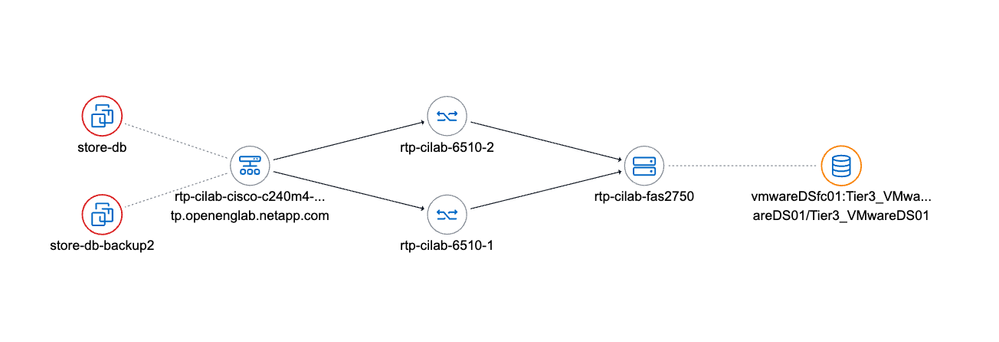
This is where Data Infrastructure Insights comes into play, drastically reducing the MTTI for storage teams by offering a full topology view of the data path and detailed infrastructure change analysis.

Infrastructure change analysis tracks configuration and topology changes across the entire, heterogeneous environment, and correlates these changes with metrics and alerts from related resources in the application’s data path. This allows teams to clearly and quickly identify the cause & effect of incidents in a way that storage-centric tooling just can’t provide.
How are changes Identified?
I’m glad you asked!
Data Infrastructure Insights has two different ways it detects changes in the infrastructure.
Understanding the first type of change means first understanding that Data Infrastructure Insight's data model builds and maintains a picture of the entire environment when data is collected. This records the topology, configuration, attributes and relationships of all infrastructure assets. As infrastructure assets continue to be polled for information over time, any differences between these polls are detected as an infrastructure change. For example, a Brocade FC switch was FOS 9.2.1 on the last collection, and 9.2.2 on the next? A firmware update can be recorded as a change.
This internal data model is what makes DII special for all sorts of use cases, not just change analysis. It’s a heterogeneous model so not only can these changes be detected across all infrastructure vendors, but it also means workflows for performance and capacity management, migration, monitoring and alerting are consistent across all vendors too. This reduces risk and toil when managing workloads across a hybrid environment, and also streamlines migrations between vendors and to/from cloud by providing "business as usual" consistency throughout the entire migration project.
The second type of change is based on event logs from certain data sources, such as VMware or ONTAP. Like most event logs, these can be very chatty, so there is smart filtering on the incoming logs to ensure that only relevant events are identified as a change. For instance, a virtual machine migration event from VMware would be recorded as a change, whereas a simple informational message would not be.
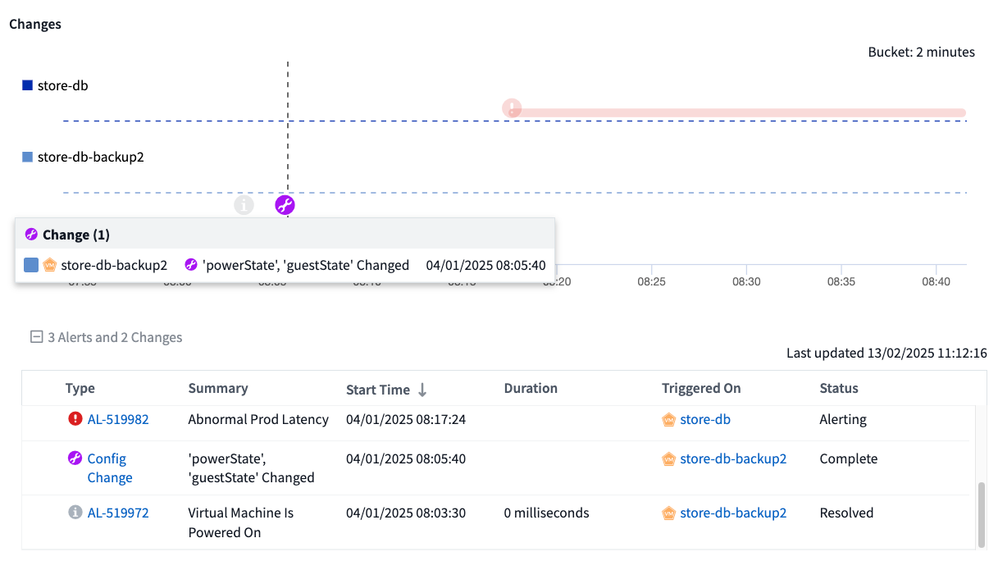
Much like the timeline example above, these changes and are overlaid onto a timeline of events and alerts for all assets across an application’s data path.

Here the change is shown and there’s a very clear correlation between a backup virtual machine being powered on and abnormal latency being detected on a related production database virtual machine: cause and effect.
And because abnormal spikes in latency would almost always end up in the storage team’s incident queue, this clear identification of cause and effect leads to a vastly accelerated mean time to innocence for the storage team, and overall a much quicker MTTR.
See the full video demo of this example here to find out more.
Accelerate your mean time to innocence
With advanced tools like Data Infrastructure Insights, storage operations teams can quickly prove their innocence and help identify the real root causes of problems. By leveraging a full topology view and comprehensive change analysis, storage teams can shift the focus from blame to resolution, ensuring smoother operations and happier users.
If you're a current ONTAP user, you can get started with Data Infrastructure Insights basic edition at no additional cost, included with your NetApp support and now including the new SAN Analyzer feature for VM-to-LUN visibility. While you're there be sure to check out the free trial of Premium edition features including infrastructure change analysis.