Active IQ Unified Manager Discussions
- Home
- :
- Active IQ and AutoSupport
- :
- Active IQ Unified Manager Discussions
- :
- Can't import / export Grafana with netapp-manager
Active IQ Unified Manager Discussions
- Subscribe to RSS Feed
- Mark Topic as New
- Mark Topic as Read
- Float this Topic for Current User
- Bookmark
- Subscribe
- Mute
- Printer Friendly Page
- Mark as New
- Bookmark
- Subscribe
- Mute
- Subscribe to RSS Feed
- Permalink
- Report Inappropriate Content
Hi all,
I'm trying to install NetApp Harvest + Grafana + Graphite.
In the ultimate step i have this error :
root@infxprep01:/opt/netapp-harvest# /opt/netapp-harvest/netapp-manager -import
[OK ] Will import dashboards to http://127.0.0.1:443
[ERROR ] Failed to import dashboard [db_netapp.json] due to error: 500 addr is not a string
[ERROR ] -Response was :addr is not a string at /usr/share/perl5/IO/Socket/IP.pm line 750.
I use Debian 8.0 / Grafana 2.5 and the latest NetApp Harvest release.
I don't understand the probleme with the JSON.
URL is good, port is 443, i'm using https.
I would like to say that the JSON.pm wasn't present in the netapp harvest zip ( in netapp-manageability-sdk-5.4P1/lib/perl/NetApp/).
It was install from debian repository
apt-get install libjson-perl
Thanks for any help.
Solved! See The Solution
- Mark as New
- Bookmark
- Subscribe
- Mute
- Subscribe to RSS Feed
- Permalink
- Report Inappropriate Content
Hi,
[OK ] Will import dashboards to http://127.0.0.1:443
I bet that should https://128.0.0.1:443
Cheers,
Chris Madden
Storage Architect, NetApp EMEA (and author of Harvest)
Blog: It all begins with data
P.S. Please select “Options” and then “Accept as Solution” if this response answered your question so that others will find it easily!
- Mark as New
- Bookmark
- Subscribe
- Mute
- Subscribe to RSS Feed
- Permalink
- Report Inappropriate Content
I'm sorry It was obvious ... 😕
I have another real problem this one ...
I have installed all the chain tool.
I have only 7-mode DataOnTap SAN.
netapp-harvest look working find.
[2015-12-10 11:43:17] [NORMAL ] WORKER STARTED [Version: 1.2.2] [Conf: netapp-harvest.conf] [Poller: SAN13-c1]
[2015-12-10 11:43:17] [NORMAL ] [main] Poller will monitor a [FILER] at [SAN13-c1:443]
[2015-12-10 11:43:17] [NORMAL ] [main] Poller will use [password] authentication with username [netapp-harvest] and password [**********]
[2015-12-10 11:43:17] [NORMAL ] [main] Collection of system info from [SAN13-c1] running [NetApp Release 8.1.3P3 7-Mode] successful.
[2015-12-10 11:43:17] [NORMAL ] [main] Using best-fit collection template: [7dot-8.1.0.conf]
[2015-12-10 11:43:17] [NORMAL ] [main] Using graphite_root [netapp.perf7.SDC3.SAN13-c1]
[2015-12-10 11:43:17] [NORMAL ] [main] Using graphite_meta_metrics_root [netapp.poller.perf7.SDC3.SAN13-c1]
[2015-12-10 11:43:17] [NORMAL ] [main] Startup complete.  Polling for new data every [60] seconds.
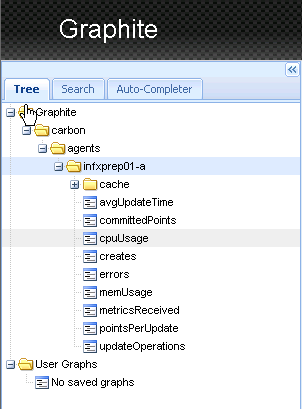
But in Graphite (port 81) , I'don't see any data :
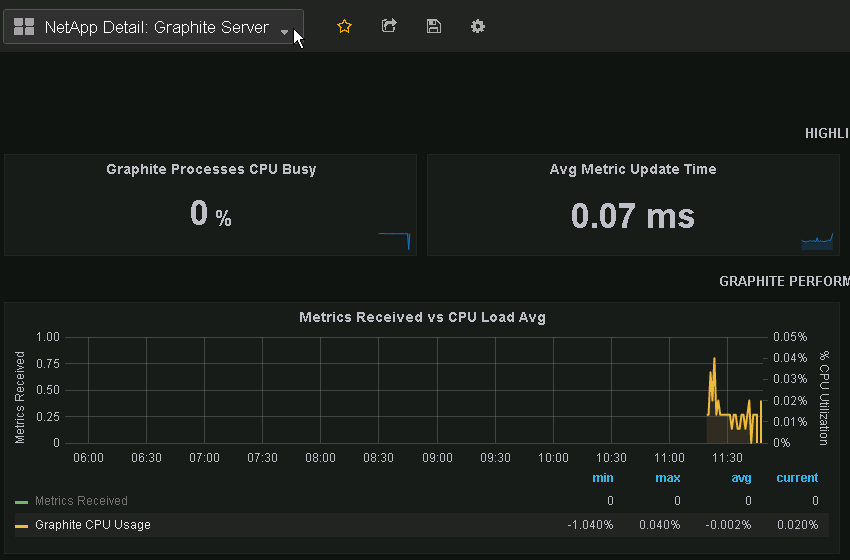
And In Graphana ... The only data I have is from the Graphana server activity :
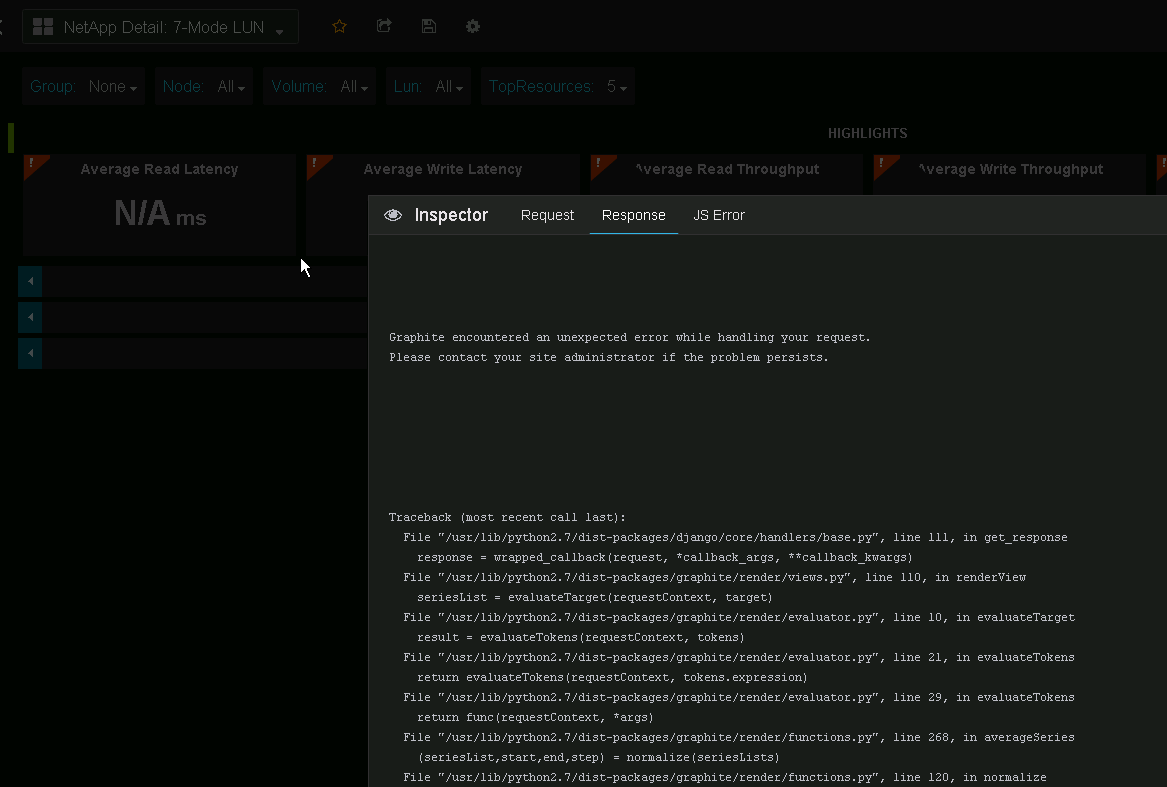
But All the data from the SAN don't appears .. I have nothing or a Python Error ...
I have followed the installation guide on Debian 8.0, I don't understand where is the probleme ..
- Mark as New
- Bookmark
- Subscribe
- Mute
- Subscribe to RSS Feed
- Permalink
- Report Inappropriate Content
Hi @fcoudert,
I would check the log in /opt/netapp-harvest/log/ to see if there are any errors about sending the data to the graphite system. After starting with about 2 minutes the first metrics will be sent to Graphite cabon service and if there is a connection problem it will display an error, otherwise they are being received. Next the Graphite carbon service has to write these to disk. If the disk is full, or there is a permissions issue, this will fail, so this is something to check. You can also check the carbon logfile 'creates.log' for status of the created metrics files to look for errors. That log can vary based on distribution but is usually in /var/log/carbon, /var/log/graphite-carbon, or /opt/graphite/storage/log/carbon-cache/carbon-cache-a/.
Hope this helps!
Cheers,
Chris Madden
Storage Architect, NetApp EMEA (and author of Harvest)
Blog: It all begins with data
P.S. Please select “Options” and then “Accept as Solution” if this response answered your question so that others will find it easily!
- Mark as New
- Bookmark
- Subscribe
- Mute
- Subscribe to RSS Feed
- Permalink
- Report Inappropriate Content
Thanks for you help the problem was on the port carbon-graphite configuration between harvest and graphite.
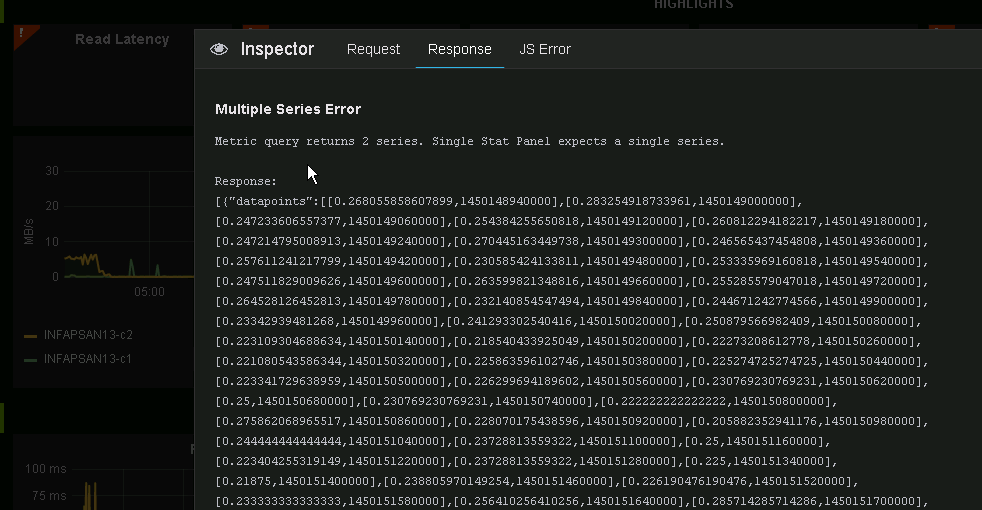
Now all it's great except some little probleme, in a working dashboard I have some metrics who said they have problemes with data series.
And
- Mark as New
- Bookmark
- Subscribe
- Mute
- Subscribe to RSS Feed
- Permalink
- Report Inappropriate Content
I would like to say that's the problems metrics are only with "mutliple series" in 7-mode groups in the CPU / DISK R/W.
Otherwise, All is running fine 🙂
Thank's for this good tool !
- Mark as New
- Bookmark
- Subscribe
- Mute
- Subscribe to RSS Feed
- Permalink
- Report Inappropriate Content
Maybe you are running a Grafana release newer than 2.3.1? If yes then updated dashboards are needed, see here for more: http://blog.pkiwi.com/grafana-2-5-support-with-netapp-harvest/
Cheers,
Chris
- Mark as New
- Bookmark
- Subscribe
- Mute
- Subscribe to RSS Feed
- Permalink
- Report Inappropriate Content
Thank's so much for your help !
All is working fine and my boss love the graphics 😉
Just a last question.
I have an old metrocluster FAS3140 on DataOntap Release 8.0.3P3 7-Mode and the TLS options seem don't exist on this version 😕
Do you have an alternative way for no-tls controlers ?
- Mark as New
- Bookmark
- Subscribe
- Mute
- Subscribe to RSS Feed
- Permalink
- Report Inappropriate Content
Good to hear things are working for you now!
For non-TLS controllers you *might* be able to use an older version of the NetApp SDK to allow it.
Get SDK 5.3: http://mysupport.netapp.com/NOW/download/software/nmsdk/5.3/
So try the following:
1) Download from the support site and copy into /tmp.
2) Extract it:
cd /tmp
unzip netapp-manageability-sdk-5.3.zip netapp-manageability-sdk-5.3/lib/perl/NetApp/*
3) Stop the poller
/opt/netapp-harvest/netapp-manager -stop
4) Rename current lib
mv /opt/netapp-harvest/lib /opt/netapp-harvest/lib-5.4
5) Copy 5.3 lib in place
mv netapp-manageability-sdk-5.3/lib/perl/NetApp/* /opt/netapp-harvest/lib
6) Start poller
/opt/netapp-harvest/netapp-manager -start
Let me know if it works!
If it doens't help you can revert to the original library by doing step 3, rm -rf /opt/netapp-harvest/lib, mv /opt/netapp-harvest/lib-5.4 /opt/netapp-harvest/lib, and then step 6 again.
Cheers,
Chris Madden
- Mark as New
- Bookmark
- Subscribe
- Mute
- Subscribe to RSS Feed
- Permalink
- Report Inappropriate Content
Grafana dashboard is not displaying imported objects from /opt/netapp-harvest/netapp-manager –import though they appear to import with no errors… Any thought, guidance?
[OK ] Will import dashboards to http://localhost:443
[OK ] Imported dashboard [db_netapp-detail-lun.json] successfully
[OK ] Imported dashboard [db_netapp-dashboard-7-mode-group.json] successfully
[OK ] Imported dashboard [db_netapp-dashboard-7-mode-node.json] successfully
[OK ] Imported dashboard [db_netapp-dashboard-cluster.json] successfully
[OK ] Imported dashboard [db_netapp-detail-volume.json] successfully
[OK ] Imported dashboard [db_netapp-detail-7-mode-network-port.json] successfully
[OK ] Imported dashboard [db_netapp-detail-network-lif.json] successfully
[OK ] Imported dashboard [db_netapp-detail-disk-and-cache-layers.json] successfully
[OK ] Imported dashboard [db_netapp-detail-7-mode-windows-file-services.json] successfully
[OK ] Imported dashboard [db_netapp-detail-7-mode-disk-and-cache-layers.json] successfully
[OK ] Imported dashboard [db_netapp-dashboard-cluster-group.json] successfully
[OK ] Imported dashboard [db_netapp-dashboard-node.json] successfully
[OK ] Imported dashboard [db_netapp-detail-harvest-poller.json] successfully
[OK ] Imported dashboard [db_netapp-detail-7-mode-volume.json] successfully
[OK ] Imported dashboard [db_netapp-detail-network-port.json] successfully
[OK ] Imported dashboard [db_netapp.json] successfully
[OK ] Imported dashboard [db_netapp-detail-7-mode-lun.json] successfully
[OK ] Imported dashboard [db_netapp-dashboard-svm.json] successfully
[OK ] Imported dashboard [db_netapp-detail-graphite-server.json] successfully
- Mark as New
- Bookmark
- Subscribe
- Mute
- Subscribe to RSS Feed
- Permalink
- Report Inappropriate Content
>>Will import dashboards to http://localhost:443
You look to use http and 443 which seems wrong. Probably should have https.
I will take a look at the error handling logic as to why it claimed success by mistake in this situation.
Cheers,
Chris
- Mark as New
- Bookmark
- Subscribe
- Mute
- Subscribe to RSS Feed
- Permalink
- Report Inappropriate Content
Same error
[OK ] Will import dashboards to https://127.0.0.1:443
[ERROR ] Failed to import dashboard [db_netapp-detail-graphite-server.json] due to error: 500 SSL_verify_mode must be a number and not a string
[ERROR ] -Response was :SSL_verify_mode must be a number and not a string at /usr/share/perl5/IO/Socket/SSL.pm line 2130.
I have tried also http://127.0.0.1:443 with no luck.
- Mark as New
- Bookmark
- Subscribe
- Mute
- Subscribe to RSS Feed
- Permalink
- Report Inappropriate Content
Hi @iparboy
Actually your error is different and seems to be an interop issue between Harvest 1.2.2 and a newer version of the IO::Socket:SSL library.
To fix do the following:
1) Edit netapp-manager:
nano /opt/netapp-harvest/netapp-manager
2) Add a new line at line 25 as in green below:
 use JSON;
 use LWP;
 use IO::Socket;
 use IO::Socket::SSL;
3) Modify line 156 to remove the `` around SSL_VERIFY_NONE as shown below:
FROM: my $ua = LWP::UserAgent->new( ssl_opts => {verify_hostname => 0, SSL_verify_mode => 'SSL_VERIFY_NONE'}, timeout => 10);
TO:   my $ua = LWP::UserAgent->new( ssl_opts => {verify_hostname => 0, SSL_verify_mode => SSL_VERIFY_NONE}, timeout => 10);
4) Save and exit.
Thereafter your netapp-manager -import and -export should work. Please confirm that this solves the issue (and give a kudos!)
I have also fixed and it in main and it will be in the next Toolchest release.
Cheers,
Chris Madden
Storage Architect, NetApp EMEA (and author of Harvest)
Blog: It all begins with data
If this post resolved your issue, please help others by selecting ACCEPT AS SOLUTION or adding a KUDO or both!


