Active IQ Unified Manager Discussions
- Home
- :
- Active IQ and AutoSupport
- :
- Active IQ Unified Manager Discussions
- :
- Re: NetApp Harvest and Grafana dashboards
Active IQ Unified Manager Discussions
- Subscribe to RSS Feed
- Mark Topic as New
- Mark Topic as Read
- Float this Topic for Current User
- Bookmark
- Subscribe
- Mute
- Printer Friendly Page
- Mark as New
- Bookmark
- Subscribe
- Mute
- Subscribe to RSS Feed
- Permalink
- Report Inappropriate Content
Hello. I have some questions regarding Harvest and Grafana. Right now I 'm running version 1.4 and want to upgrade to version 1.4.2. I saw in the release notes that new dashboards for Grafana have been implemented.
Will re-importing the dashboards cause duplicates? Documentation says that existing dashboards of the same name will be overwritten. What happens with the data collected so far for those dashboards?
Thanks,
G
Solved! See The Solution
- Mark as New
- Bookmark
- Subscribe
- Mute
- Subscribe to RSS Feed
- Permalink
- Report Inappropriate Content
not sure if it's applicable to all of you, but for the archives: I had the same problem, update of grafana from 6.3.2 to 6.3.3 fixed it for me.
- Mark as New
- Bookmark
- Subscribe
- Mute
- Subscribe to RSS Feed
- Permalink
- Report Inappropriate Content
Hello G,
The upgrade of Harvest is pretty safe for existing data.
First of all, regarding the actual performance data, this all happens in Graphite,a nd Harvest isn't touching, except to add new metrics, so a Harvest upgrade will never remove performance and capacity data.
Regarding your dashboards, you might have noticed that Harvest dahboards have special tags on it :
Only dashboards having these tags will be deleted and replaced (again, without touching the actual data), so if you have any dashboards of your own without these tags, they are safe as well.
Hope this helps.
- Mark as New
- Bookmark
- Subscribe
- Mute
- Subscribe to RSS Feed
- Permalink
- Report Inappropriate Content
Thanks Yann. I 'll give it a go and report back. My Harvest host is a VM anyway so I can snapshot it before the update.
- Mark as New
- Bookmark
- Subscribe
- Mute
- Subscribe to RSS Feed
- Permalink
- Report Inappropriate Content
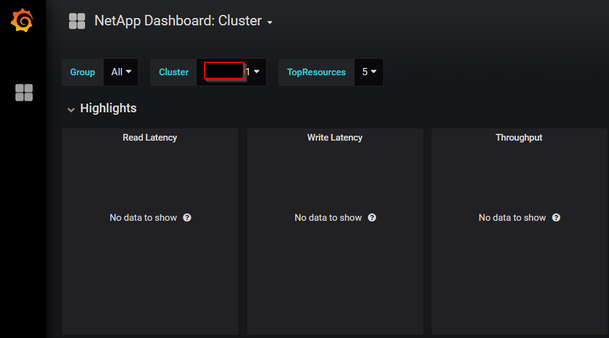
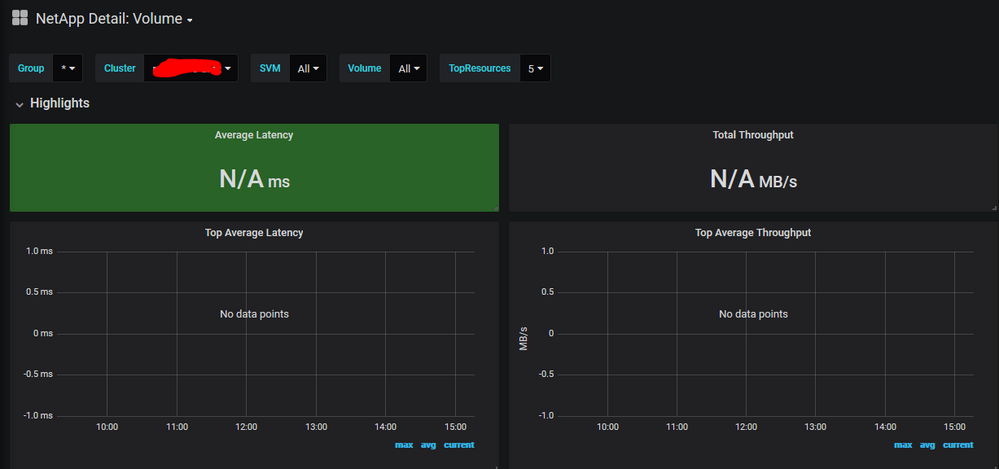
Oh, one other question that is not strictly related to Harvest, but it's more about Grafana. Any idea why for certain dashboards when I select anything different to All, I see no data? For example see below screenshot:
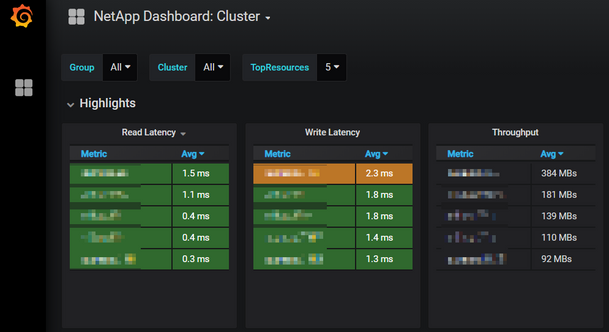
But when all clusters are selected then no problems at all:
Thanks,
G
- Mark as New
- Bookmark
- Subscribe
- Mute
- Subscribe to RSS Feed
- Permalink
- Report Inappropriate Content
I think I figured it out. At least two resources need to be selected. Meh...
- Mark as New
- Bookmark
- Subscribe
- Mute
- Subscribe to RSS Feed
- Permalink
- Report Inappropriate Content
That shouldn’t be the case, you should be able to select a single cluster in this dashboard
- Mark as New
- Bookmark
- Subscribe
- Mute
- Subscribe to RSS Feed
- Permalink
- Report Inappropriate Content
Try a single cluster, but use one of those that are visible in the stat tables when using "All".
That specific one you just tried (not showing any data) might not have any statistics collected.
- Mark as New
- Bookmark
- Subscribe
- Mute
- Subscribe to RSS Feed
- Permalink
- Report Inappropriate Content
Hi bkamil. That's not the case. And as I said I have noticed that behaviour with some of the other dashboards, eg the one for volumes. May be that's a Grafana bug. I have to update the host anyway to get new versions of all the software components. I 'll see how that goes and report back. Thanks
- Mark as New
- Bookmark
- Subscribe
- Mute
- Subscribe to RSS Feed
- Permalink
- Report Inappropriate Content
The upgrade went well including (re-)importing (and adding) the (new) dashboards, however I still have the issue described in one of my previous posts when selecting a single resource in a Grafana dashboard. I 'll take that with the Grafana community, unless if somebody else has seen that behaviour before and found a solution. Thanks for the help all ![]()
- Mark as New
- Bookmark
- Subscribe
- Mute
- Subscribe to RSS Feed
- Permalink
- Report Inappropriate Content
I'm afraid the Grafana community won't be able to help, it has to be related to the data.
Can you share another screenshot of a cluster that displays data in "All", but nothing when selected ?
- Mark as New
- Bookmark
- Subscribe
- Mute
- Subscribe to RSS Feed
- Permalink
- Report Inappropriate Content
Hi,
I'm experiencing exactly the same phenomenon.
Working with netapp-harvest+carbon+graphite+grafana as recommended in Netapp's manual.
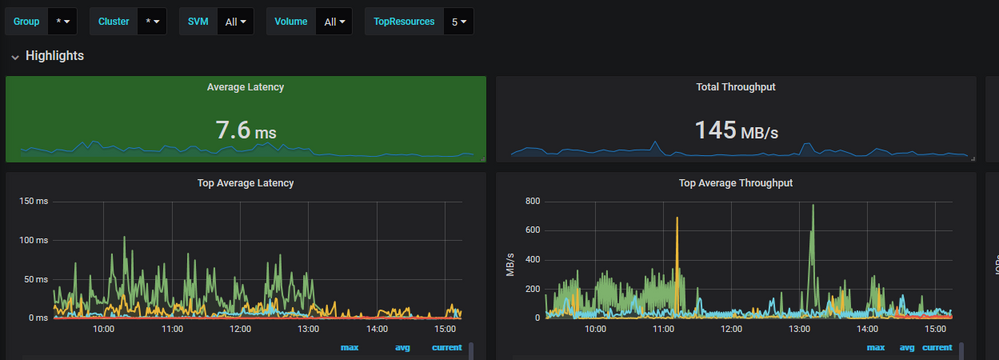
When selecting ALL (or *), it shows all the data
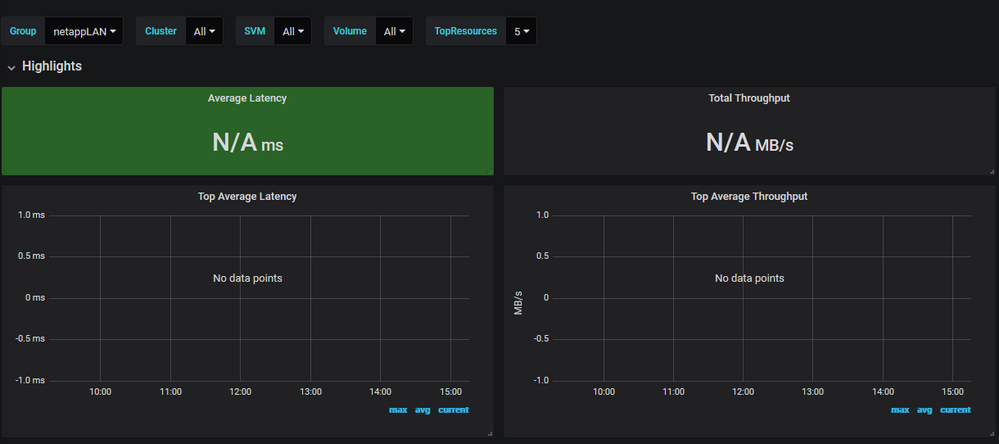
When selecting a specific group\cluster\svm\vol, no data is showed.
Images below:
- Mark as New
- Bookmark
- Subscribe
- Mute
- Subscribe to RSS Feed
- Permalink
- Report Inappropriate Content
At least it's not only me. Unfortunately, I wasn't able to follow up with this due to other things happening.
- Mark as New
- Bookmark
- Subscribe
- Mute
- Subscribe to RSS Feed
- Permalink
- Report Inappropriate Content
One more "funny" thing i found is that if you select 2 or more objects (vols, SVMs) it also shows data
But when selecting 1 object, there is nothing 🙂
- Mark as New
- Bookmark
- Subscribe
- Mute
- Subscribe to RSS Feed
- Permalink
- Report Inappropriate Content
Do you have other groups in the menu ?
Could it be a privilege issue in the whisper directory ?
- Mark as New
- Bookmark
- Subscribe
- Mute
- Subscribe to RSS Feed
- Permalink
- Report Inappropriate Content
@yannb wrote:
Do you have other groups in the menu ?
Could it be a privilege issue in the whisper directory ?
I have 2 groups in the menu,
Whisper directory permissions:
drwxr-xr-x. 5 carbon carbon 46 May 2 18:30 whisper
- Mark as New
- Bookmark
- Subscribe
- Mute
- Subscribe to RSS Feed
- Permalink
- Report Inappropriate Content
So if you select one group, you see no data, if you select the other, you see no data, and if you select All, you see data ?
What's the content and permissions of whisper/netapp/perf ?
- Mark as New
- Bookmark
- Subscribe
- Mute
- Subscribe to RSS Feed
- Permalink
- Report Inappropriate Content
@yannb wrote:
So if you select one group, you see no data, if you select the other, you see no data, and if you select All, you see data ? - Exactly.
also, if i select ALL(*) groups, i can select 2 volumes and it shows "only" both of them (even from different groups) but never a single anything.
What's the content and permissions of whisper/netapp/perf ?
whisper/netapp/perf content and permissions
Thanks for the help! 🙂
- Mark as New
- Bookmark
- Subscribe
- Mute
- Subscribe to RSS Feed
- Permalink
- Report Inappropriate Content
Are there any characters that would be considered "special" in object names ?
- Mark as New
- Bookmark
- Subscribe
- Mute
- Subscribe to RSS Feed
- Permalink
- Report Inappropriate Content
@yannb wrote:
Are there any characters that would be considered "special" in object names ?
The group names contain capital letters, does it count as special?
Other then that, there are hyphens "-" in the cluster\node\vol names...
Nothing else...
- Mark as New
- Bookmark
- Subscribe
- Mute
- Subscribe to RSS Feed
- Permalink
- Report Inappropriate Content
Have the same error, hopefully there is a solution soon.
(I think it's problem with the dashboards.)
- Mark as New
- Bookmark
- Subscribe
- Mute
- Subscribe to RSS Feed
- Permalink
- Report Inappropriate Content
I also think it's a problem with the dasbhoard,
When going to "Explore" in grafana, you can select whatever single metric you want...
Now i just neet to learn the grafana syntax as well 😄

