This site will enter Read Only mode on July 23 as we prepare to move to a new platform. You will still be able to view content, but posting and replying will be temporarily disabled.
We're excited to launch our new Community experience on July 30 and more information will follow soon.
Stay connected during the transition - Join our Discord community today.
ONTAP Hardware
- Home
- :
- ONTAP, AFF, and FAS
- :
- ONTAP Hardware
- :
- Re: Unexplained read and write latency
ONTAP Hardware
- Subscribe to RSS Feed
- Mark Topic as New
- Mark Topic as Read
- Float this Topic for Current User
- Bookmark
- Subscribe
- Mute
- Printer Friendly Page
- Mark as New
- Bookmark
- Subscribe
- Mute
- Subscribe to RSS Feed
- Permalink
- Report Inappropriate Content
From time to time I have very high peaks of write as well as reads latenvy.
FAS3250 8.1.4P7
I cannot correlate it to anything.
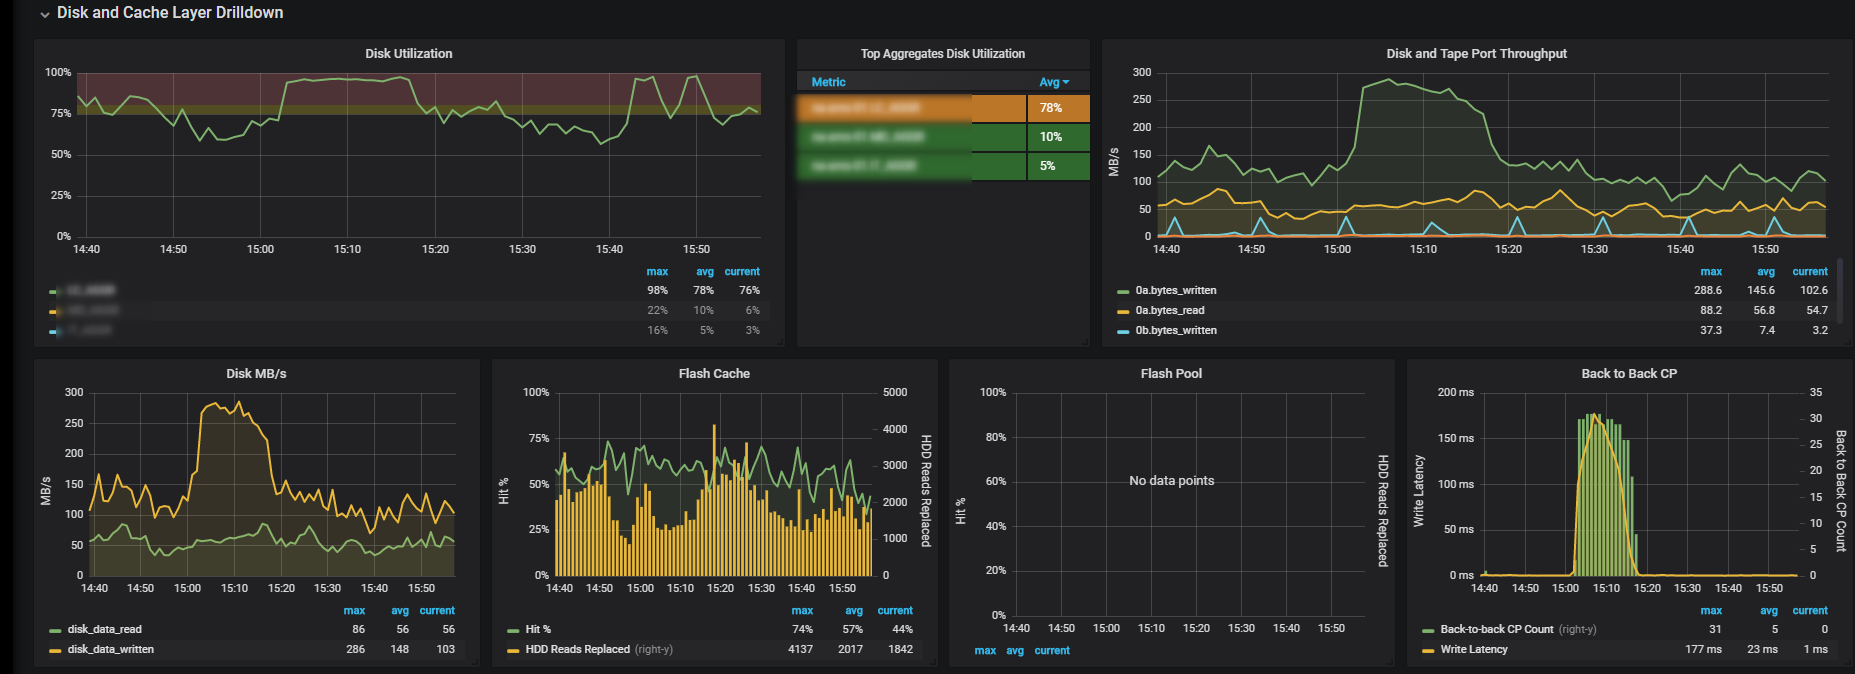
Here is some data from harvest:

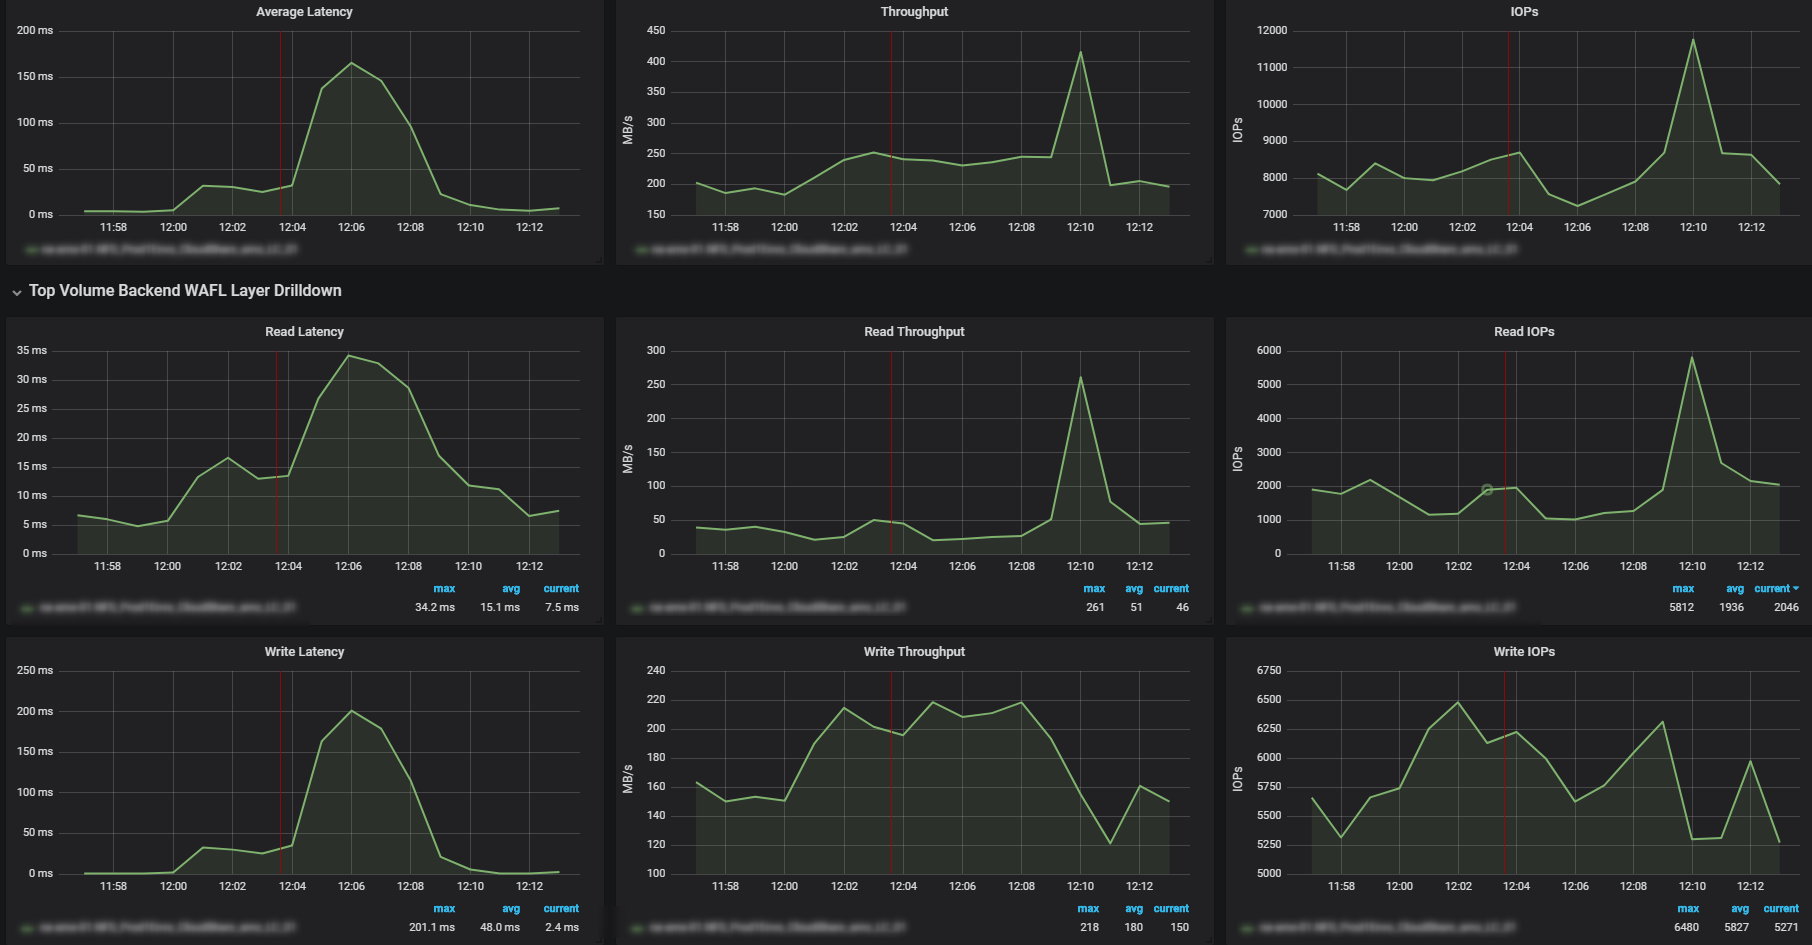
zoomed in to a specific high latency point:


even more zoom:


Maybe throughput correlates a little but I don't think it should have this impact.
Any idea what to look for next?
- Mark as New
- Bookmark
- Subscribe
- Mute
- Subscribe to RSS Feed
- Permalink
- Report Inappropriate Content
So you have actual 200MBps write workload happening on that vol. the disks writing in 250MBps, and are 100% busy
the latency could be related to the disk responsiveness - but could be also because of the type of workload the coming at that specific time (the round trip from memory allocation until write acknowledge)
Are you trying to understand what this activity involved here? because if so you need to look on the client activity according to the protocols used to access the volume
Or you trying to understand why it causing the latency spike ? you can find some numbers if you run the following during the time of a peak, and during normal time and try to easy-pick the abnormal ones.
priv set advanced;statit -b
wait 1-2 min
priv set advanced;statit -e
i'm not aware for silimar output in an API command for 7-mode. so i guess harvest don't have these numbers in, (it's also not exists in DFM)
- Mark as New
- Bookmark
- Subscribe
- Mute
- Subscribe to RSS Feed
- Permalink
- Report Inappropriate Content
Thank Gidon,
stattit or DFM did not yeild any additional information that Harvest could not provice.
I agree that this latency peak correlates to high bandwitdh and high disk utilization - the thing is that the other way around it does not correlate.
Meaning, I have instances where I have (as) high bandwith and disk% which does not result in high latency. What could be the reason for this?
What are the reasons for high disk util% in general? How come for same bandwith/IOPS/Block size sometimes results in high disk % and some times does not?
Are there any other factors I am not aware of?
Since this happens not so frequently, statit will not be efficient. Will need to know in advance when it happens so I can run it in advance. But do I really need to know anything about the clients?
- Mark as New
- Bookmark
- Subscribe
- Mute
- Subscribe to RSS Feed
- Permalink
- Report Inappropriate Content
Hi
written before seeing your last screenshot - but still give perspective
---------
Assuming you comparing apples to apples (same clients on the same location on the network, same volume, same aggr, same block sizes....... )
it could be because of a process running in the background with high priority (for example block reclamation will run on high priority if you short on free space)
or this could be related to the command the clients are using/translating in ONTAP.
Latency measured differently for each command by each protocol and by each vendor.
e.g there could be a protocol command that translates to a WAFL command that hammering the disks and using large throughput but measured as a low latency.
i given the example of write latency measurement with SCSI based protocols.
if we compare it to a read - the latency measured from the time the request came until the response leaves. which means that unlike a write we don't even have dependency on the client and network, just on the filer and it's back-end
------
adding after seeing your last response:
---------
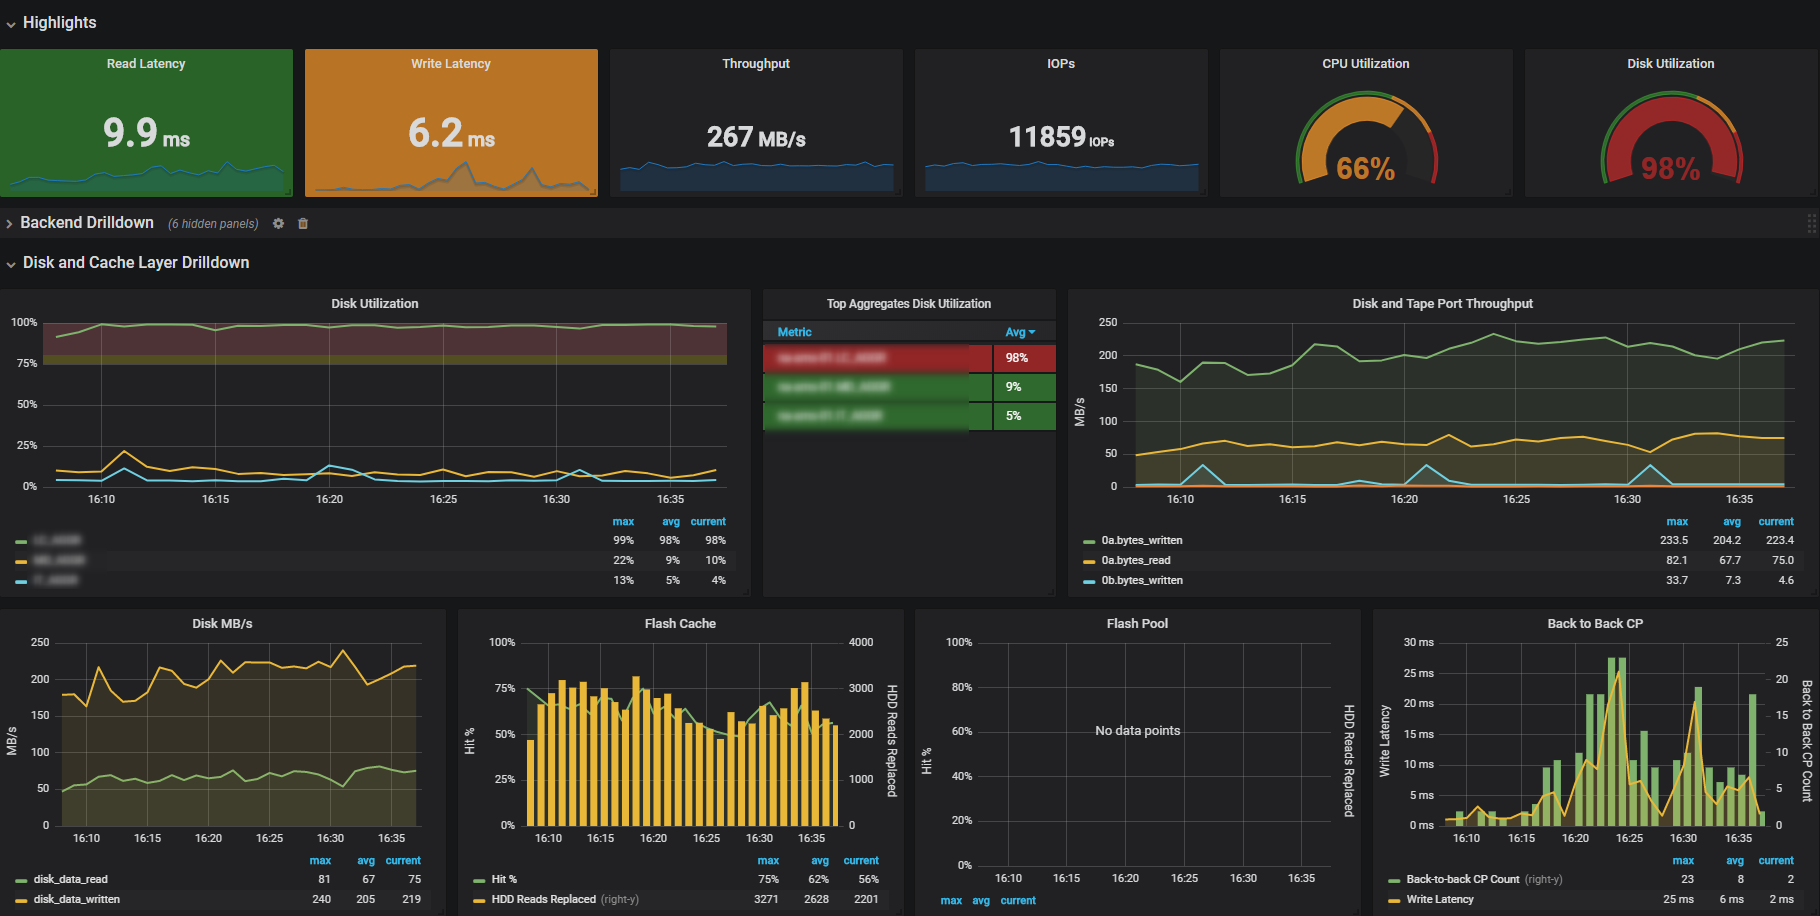
The screenshot on the last message suggest you hammering the disks a bit differently.
first - let's ignore the disk Util. the number you see there is the highest "ut% is the percent of time the disk was busy." of any disk in the system (quote taken from statit itself)
The Back to back you have there is less aggressive, the throughput is 25% lower and the IOPS is actually 15-20% higher.
So here you maybe have a bit different characteristics (IO size for example) or you have an earlier bottleneck then the storage (maybe the client CPU or network card are busy with something else so it less hammering the storage)
the statit output could have show us the real numbers of real WAFL command that causes the heat vs the time it dosen't .
Also from these graphs we only see up to the aggr level and not individual disk / raid group.
(you could have some condition in the RAID that need addressing and we can't see here - such bad disk, hot disk, hot parity, hot raid group)
if the above clear out as all-good and i was in a NetApp hat i would say you need more spindles to get rid of the latency.
but i think you should estimate if it right for you. if you see an acutel user impact maybe throttle a bit this activity to avoid the back to back and impact other AGGRs and workloads.
if you don't - just ignore it and let the filer work as fast as it can.
Gidi
- Mark as New
- Bookmark
- Subscribe
- Mute
- Subscribe to RSS Feed
- Permalink
- Report Inappropriate Content
Thanks Gidi for this thorough reply.
All clients are ESXi servers so in that respenct IO is pretty homogenous (at least statisticly speaking).
This is why I want to understand why on (roughly) the same throughput and IOPS I sometimes get B2BCP and sometimes I don't.
What kind of processes can be running in the backgroud? I already verified it's not dedup or snapmirror.
How can I see what it scheduled to run in 7-mode? I do see that in most of the time the peaks are at the same time of day (and a round hour).
I checked disk util and all are ~99% not just a single one.
- Mark as New
- Bookmark
- Subscribe
- Mute
- Subscribe to RSS Feed
- Permalink
- Report Inappropriate Content
Hi
Sound like you really hit what the disk can give you.. there's a lot of online tools that you can put the disk type, count, raid type, read-write ratio (on the give time of the problem) and get what the max bandwidth the disk can give you. if you are close to it - the latency is expected,
i don't think seeing the whole ESX workload as one is right.. it's averaging out and obscures the costly workload, but it's still a singular workload with specific pattern hiding inside.
A boot storm, AV scan and SQL indexing are all heavy read and all are trying to get as much IO as they can. but the IO pattren and penalty on the disks will look completely different on each.
i don't know what behind the write workload in your two cases. it could be the exact same type - but on one of them you hit a bottleneck like the VM CPU / RAM assignment. and it could be completely different one.
The costly background operations will hide in this output:
priv set advanced;wafl scan status -A;wafl scan status -V
ignore the "active bitmap rearrangement " and you can see the meaning of the others here:
https://kb.netapp.com/support/index?page=content&id=3011346
i highly encourage to open a case. there's lot of data that NetApp can see and analyze from a perfstat that will not be seen in a naked eye or tools availble to the customers,
customers that can't open a NetApp cases or prefer the troubleshoot performance issues themselves can use the following article to troubleshoot performance issues
https://kb.netapp.com/app/answers/answer_view/a_id/1005310
- Mark as New
- Bookmark
- Subscribe
- Mute
- Subscribe to RSS Feed
- Permalink
- Report Inappropriate Content
Currently there is only active bitmap rearrangement going on.
I'll check it while issues arrise.
- Mark as New
- Bookmark
- Subscribe
- Mute
- Subscribe to RSS Feed
- Permalink
- Report Inappropriate Content
I went over all instances of veru high latency and ALL are at the exact time, 1 minute past 1200.
That cannot be a coincedence.
What am I missing? must be some scheduled task or something.
Any idea how to tackle this?
- Mark as New
- Bookmark
- Subscribe
- Mute
- Subscribe to RSS Feed
- Permalink
- Report Inappropriate Content
An example entry.
Since all the clients to this Filer is using NFS, I do not understand what could happen between 12:00 and 12:15.

- Mark as New
- Bookmark
- Subscribe
- Mute
- Subscribe to RSS Feed
- Permalink
- Report Inappropriate Content
in the last screenshot you again have 10% increase in clients writes on that time.
if it's trigger B:B as in the other events (https://kb.netapp.com/app/answers/answer_view/a_id/1001446). it can explain both the read and the write latency.
need to see what happens on the individual datasotres and VMs on that time.(just also noticed that on zoom2.png you do have indication for much larger blocks on that time)
the KB above and the block size reminded me one thing that i did not mention before, misaligned IO can put some penalty on the disks, especially if we see sudden large IO sent.
you can find proof for such on the command nfsstat -d (https://kb.netapp.com/app/answers/answer_view/a_id/1032034).
- Mark as New
- Bookmark
- Subscribe
- Mute
- Subscribe to RSS Feed
- Permalink
- Report Inappropriate Content
Thanks Gidi,
Your comments all make sense, but...
As I pointed before, these peaks only and always happen on an exact specific time of the day for 10m.
There are many clients (ESXs) connected to it with 1000's of VMs it makes little sense to me this stems from it.
There is nothing in common with anything running on them. There are even different VMs running each day.
attaching another example when you see the high latency on this time frame but when looking at NFS IO, you see no correlation.
and since all clients are NFS only it leads me to think its something on the Netapp itself.


- Mark as New
- Bookmark
- Subscribe
- Mute
- Subscribe to RSS Feed
- Permalink
- Report Inappropriate Content
There is a category of software called Host Side Caching software which will cache VM reads and writes to in-host SSD or RAM, and by doing so it will mask any issues you might have in the storage subsystem, whether the root cause of high latency is the storage network, controllers, disks or any other component in the storage IO path. Full disclosure that I work for Virtunet Systems that has such a software for ESXi.
- Mark as New
- Bookmark
- Subscribe
- Mute
- Subscribe to RSS Feed
- Permalink
- Report Inappropriate Content

