Power and Environment monitoring with Cloud Insights
Back in August, we released a feature that we hope is the beginning of something that will change the world for better. Cloud Insights along with Harvest released dashboards to help you understand ONTAP power and environmental data across your ONTAP systems in your data center. Understanding how and where your storage systems are consuming power is the first step on our journey. In this post we'll review the power and environmental capabilities in Cloud Insights.
Already a Cloud Insights customer? This blog will help you get started with just a couple clicks. Not yet a Cloud Insights user? Head over to our introductory post with instructions to get started!
Getting Started with Power and Environment Monitoring
First things first - lets get your started. Navigate to Dashboards->Dashboards, select  to choose one of our predefined dashboard templates. Search for power - you're looking for our 'ONTAP - Power and Temperature' Dashboard.

Check the box, select  , and you should see the a new dashboard show up in your dashboard list. Anytime you return to Dashboard->Dashboards you should be able to find it under My Dashboards.

Click on the dashboard name 'ONTAP - Power and Temperature' and Power is at your fingertips.

This dashboard gets your started with Cluster, Node and Shelf power consumption. As well as environmental sensors for node and shelf temperature. Fan speeds (which increase as temperature rises) and and information around IOPS and throughput to help correlate power with demand.
Understanding the data
As we've talked to customers around the world we've found folks are consuming power in different ways. Our current power dashboard here is reflective of that and has quite a bit of content. In this section we're going to take a quick look at what's there - but most importantly we're looking to hear from you on what's important in your organization - because we're still working in this space. Also, remember dashboards are editable. If your administrator gave you privileges, hit the  button in the upper right hand corner of your screen - and you can make changes, perhaps removing content that isn't relevant to you.
Across the top, we see some basics, starting with our average hourly power consumption. Note! The values on this dashboard reflect the time period you've chosen in the top right of the dashboard bar, typically 3 hours. So we're looking at the average hourly consumption over the last 3 hours. Hit the pull down and choose up to 30 days for a longer view. Continuing, IOPS/watt helps us understand how much power we are consuming given the work we're doing, and watts/TB gives us a high level view of the running cost to store data.

The top-level environmental metrics: Max Shelf and Node temperature along with the minimum ambient temperature can be helpful in air conditioning planning for you lab. As you increase the AC temperature - decreasing the power used in cooling your lab, you can monitor its impact on storage components. As per above, remember these metrics are over the time period you selected, so make sure to choose a sufficient length of time.

The top nodes and shelves are summary views over the time window - different equipment and different configurations will have different power consumption and you may see that different times of day and different consumption patterns impact power consumption. Looking at work (IOPS and throughput) side by side with Power can help you identify correlation and trends.
Finally, If we scroll down and look at node views and shelf views we can get a much more detailed understanding of which controller and which storage media are consuming more or less power.

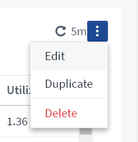
If you enter edit mode, you'll see 3 dots in the upper right of each table:

Editing the table will show you how we built it and where the metrics came from. Use the cog in the upper right of the edit screen table to add and remove attributes or adjust the query attributes after the table, perhaps restricting your query to a specific model of controller using the filter section.

Try out Cloud Insight's dashboard building technology and design your own power displays. Do you have specific reports you need for your organization's sustainability tracking initiatives? Share them with us and help NetApp help you reduce your carbon footprint. Finally, watch this section of Cloud Insights, more power info is coming. We'll be sure to announce it in our blog.