This site will enter Read Only mode on July 23 as we prepare to move to a new platform. You will still be able to view content, but posting and replying will be temporarily disabled.
We're excited to launch our new Community experience on July 30 and more information will follow soon.
Stay connected during the transition - Join our Discord community today.
Active IQ Unified Manager Discussions
- Home
- :
- Active IQ and AutoSupport
- :
- Active IQ Unified Manager Discussions
- :
- Forcing Y-axis to be 100% in Performance Advisor view?
Active IQ Unified Manager Discussions
- Subscribe to RSS Feed
- Mark Topic as New
- Mark Topic as Read
- Float this Topic for Current User
- Bookmark
- Subscribe
- Mute
- Printer Friendly Page


- Mark as New
- Bookmark
- Subscribe
- Mute
- Subscribe to RSS Feed
- Permalink
- Report Inappropriate Content
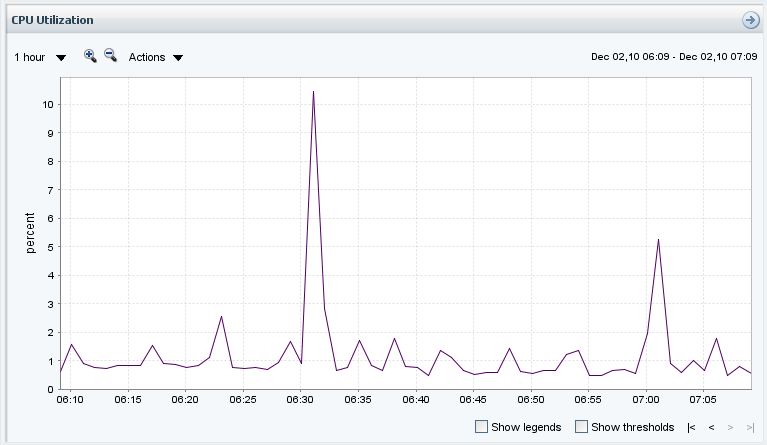
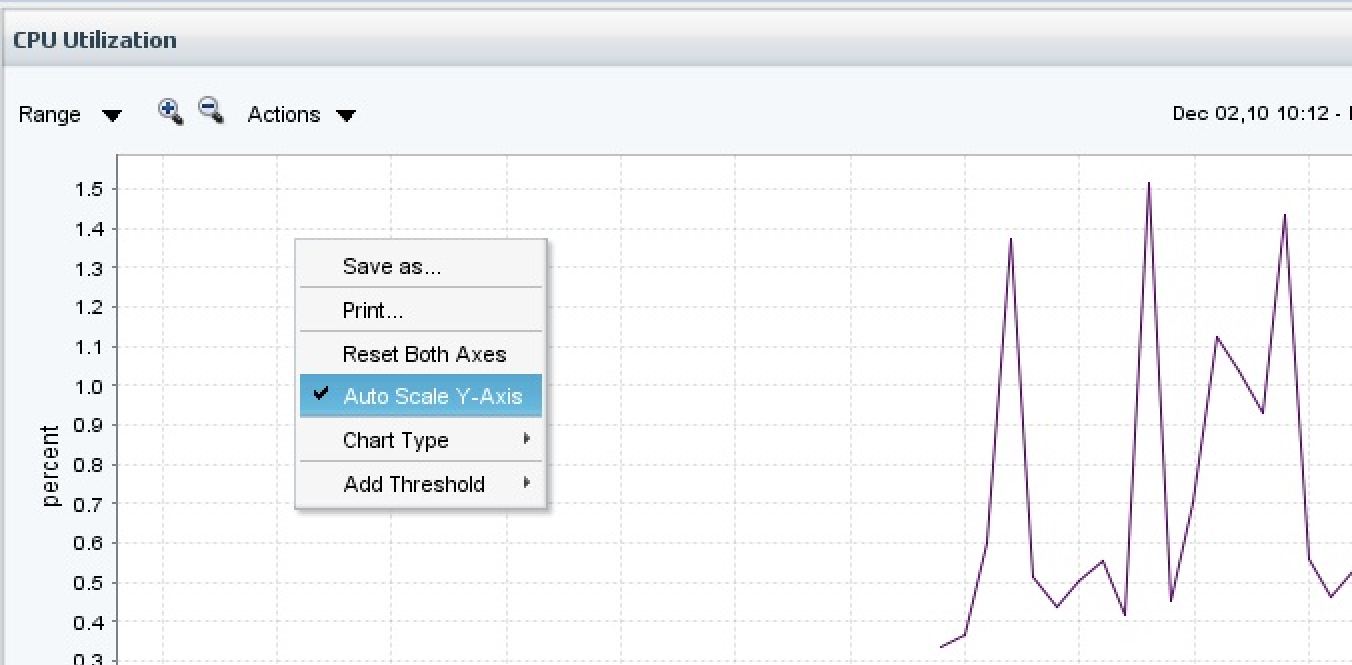
When viewing a Performance Advisor 4.0 chart with a percentage unit of measurement (i.e. CPU utilization), is there a way to force the graph to show the Y-axis with a scale from 0-to100%? By default, "auto-scale Y-axis" is enabled and the Y-axis only goes as high as the highest counter collected (see attached image). I want to view the chart with the Y-axis set from 0-to-100%. I've tried disabling auto-scale, resetting the axis, changing the time range, etc... Nothing seems to work here.
I'm looking for a way to do this without having to export the data to Excel and manipulating it there.

- Mark as New
- Bookmark
- Subscribe
- Mute
- Subscribe to RSS Feed
- Permalink
- Report Inappropriate Content
Hi,
I've tried disabling auto-scale, resetting the axis, changing the time range, etc... Nothing seems to work here.
I am aware of resetting the axis and changing the time range.
Can you let me know how you disabled auto-scale ?
Regards
adai
- Mark as New
- Bookmark
- Subscribe
- Mute
- Subscribe to RSS Feed
- Permalink
- Report Inappropriate Content
- Mark as New
- Bookmark
- Subscribe
- Mute
- Subscribe to RSS Feed
- Permalink
- Report Inappropriate Content
Aarg, I have become really dumb at night these days. I check this many times before replying to this post, but missed.
This could be a bug let me check.
Regards
adai

- Mark as New
- Bookmark
- Subscribe
- Mute
- Subscribe to RSS Feed
- Permalink
- Report Inappropriate Content
It seems you misunderstood auto scale y-axis option. If this option is selected y-axis scale dynamically based on data points. if this is un selected y-axis will freeze with current scale.
Y-axis values are defined based on data that chart rendered. So you can't set always 100%.
thanks,
Kishore.
- Mark as New
- Bookmark
- Subscribe
- Mute
- Subscribe to RSS Feed
- Permalink
- Report Inappropriate Content
Hi Kishore,
Can you explain it with examples ? I feel it’s a bug.
Say I have ops/sec in Y-Axis. With values varying from 0 to 1000.
By default the auto-scale is enabled which shows the scale of Y from 0 -1000.
What will happen if I uncheck it ?
Regards
adai
- Mark as New
- Bookmark
- Subscribe
- Mute
- Subscribe to RSS Feed
- Permalink
- Report Inappropriate Content
After uncheck no impact on the graph, but if the chart get re-rendered with new data points and suppose if the ops value is gone up to 1300, then y-axis won't get updated. Still it shows the 0 to 1000 (you can't find data points more than 1000 on the chart), if you select an auto scale option then it will shows 0 to 1300.
thanks,
Kishore