Active IQ Unified Manager Discussions
- Home
- :
- Active IQ and AutoSupport
- :
- Active IQ Unified Manager Discussions
- :
- Re: Harvest Dashboard - Netapp Detail: Volume - Difference between WAFL vs End-to-End QOS
Active IQ Unified Manager Discussions
- Subscribe to RSS Feed
- Mark Topic as New
- Mark Topic as Read
- Float this Topic for Current User
- Bookmark
- Subscribe
- Mute
- Printer Friendly Page
Harvest Dashboard - Netapp Detail: Volume - Difference between WAFL vs End-to-End QOS
- Mark as New
- Bookmark
- Subscribe
- Mute
- Subscribe to RSS Feed
- Permalink
- Report Inappropriate Content
In the Netapp Detail: Volume dashboard, what is the difference between the "Top Volume Backend WAFL Layer Drilldown" and the "Top Volume End-To-End QOS Drilldown"? In most cases, the values have been consistent, but we've recently experienced a case where the values were drastically different.
Solved! See The Solution
- Mark as New
- Bookmark
- Subscribe
- Mute
- Subscribe to RSS Feed
- Permalink
- Report Inappropriate Content
Hi @lornedornak
WAFL Layer shows the work being done by WAFL and includes queue and service time on the d-blade (node that owns the volume) including waiting on disk. IO size is max 64KB, larger client IOs are split into smaller ones before they reach WAFL.
End-to-end QoS shows the work being done by the client and includes network delay (for larger block SAN), throttle, n-blade/scsi-blade (node that owns the lif), d-blade (node that owns the volume) including waiting on disk. IO size is as requested by client (can be MBs in size)
WAFL is a reasonable proxy for the performance of the system internally, while End-to-end is better to estimate end user experience (which might include network or host issues external to storage).
In this post I have a few snippets that talk more about WAFL vs QoS which might be useful to read.
Regarding your screenshot I'm not sure what is happening. I find it quite unlikely that a single volume could do 4000MB/s of work so I'm thinking it could be some sort of counter/collection issue. Or maybe cloning (ODX, VAAI, VSC driven, etc) is reporting here and the throughput really is that high.
What is this volume used for (vol0 for a SVM maybe), does it hold data, do clients access it? Is it a mirror source or destination? Anything else unique about this volume?
Cheers,
Chris Madden
Storage Architect, NetApp EMEA (and author of Harvest)
Blog: It all begins with data
If this post resolved your issue, please help others by selecting ACCEPT AS SOLUTION or adding a KUDO or both!
- Mark as New
- Bookmark
- Subscribe
- Mute
- Subscribe to RSS Feed
- Permalink
- Report Inappropriate Content
Hi @madden,
Thanks for the clarification. The information is really useful. The issue that was captured in my screenshot has subsided. If it occurs again, I'll open a support case. I too originally thought it might have been a counter / collection issue, but discarded that theory after the issue subsided without any action from the storage team. I also eliminated Harvest as a source of error by collecting the data using the statistics show-periodic command. I was able to confirm the high throughput at the cifs_write_data counter of the volume object.
The volume originated in the traditional volume days of 7-mode (hence the name vol0). It was transitioned to cDOT in 2013. This volume has 139 qtrees of CIFS/NFS data that is accessed by clients. The volume is a source of a snapvault relationship. Other than that, there's nothing else unique about this volume.
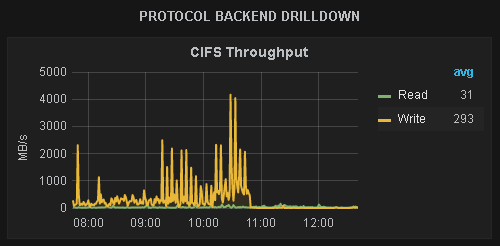
Thanks to harvest, I was able to confirm that the throughput was originating from CIFS writes:
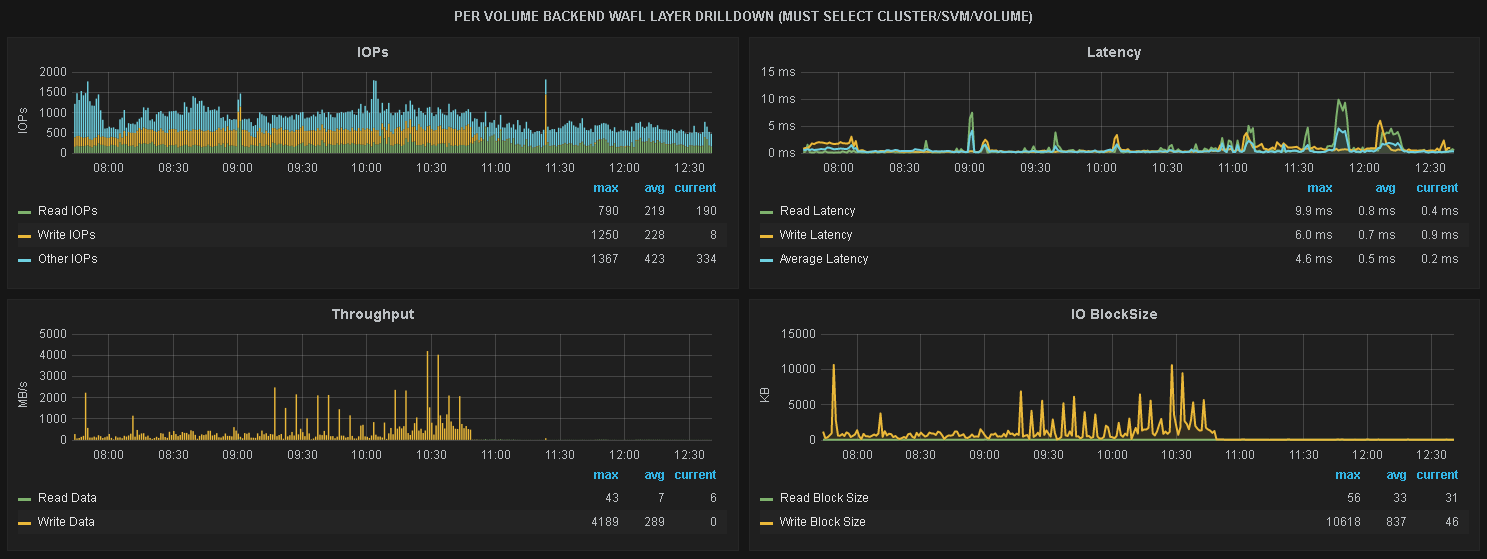
While the issue was occuring, there was no impact to other performance metrics. CPU, latency, disk IO, and IOPs were not impacted. CIFS IOPs at the time were around 500. Your mention of the 64K Max in WAFL make sense. Whatever was generating this throughput was using Large Block IO as seen in the following screenshot.
Again, thanks for the helpful information and thank you for creating Harvest. We love this tool!
- Mark as New
- Bookmark
- Subscribe
- Mute
- Subscribe to RSS Feed
- Permalink
- Report Inappropriate Content
Hi @madden,
When you say end-to-end is from the client, does it mean latency from client to the filer or latency from client to the filer and back (RTT)? Also do you know how cDOT calculates that number?
In my case I have a client accessing a volume over NFSv3
Thanks
- Mark as New
- Bookmark
- Subscribe
- Mute
- Subscribe to RSS Feed
- Permalink
- Report Inappropriate Content
Please continue discussion from @mzp45 in this other thread:


