Active IQ Unified Manager Discussions
- Home
- :
- Active IQ and AutoSupport
- :
- Active IQ Unified Manager Discussions
- :
- Re: Harvest/Graphite - "spotty" data
Active IQ Unified Manager Discussions
- Subscribe to RSS Feed
- Mark Topic as New
- Mark Topic as Read
- Float this Topic for Current User
- Bookmark
- Subscribe
- Mute
- Printer Friendly Page
- Mark as New
- Bookmark
- Subscribe
- Mute
- Subscribe to RSS Feed
- Permalink
- Report Inappropriate Content
Hello,
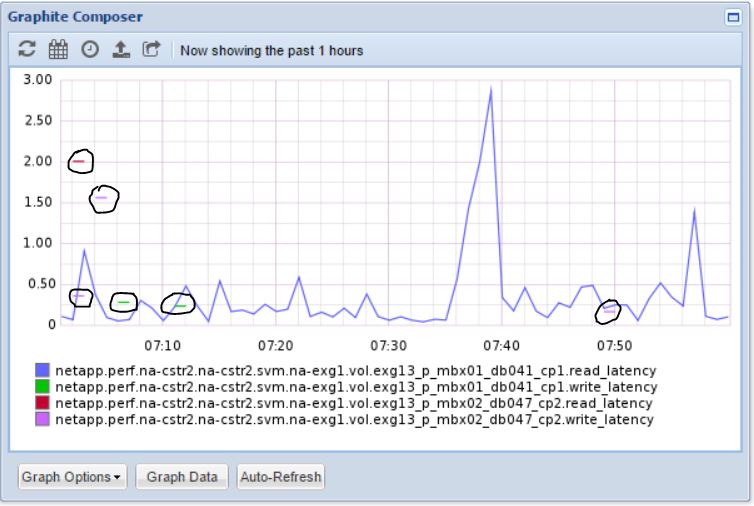
I browsed through other posts that were related to our issue, but coudn't find anything like what we're running into. Anyway, we're just now dabling with Graphite/Grafana/Harvest and we're pretty happy with the granularity of metrics that we think the tool will provide (similar to what we had with DFM and our 7DOT systems). That said, we're drilling down into some detail metrics and starting to notice that a lot of the data has some strange gaps. A particular volume, as an example, will have read and average latency statistics recorded as a continuous chart, but then the write statistics will only have a data point every half-hour or so (recorded as a "blip" on the chart). We've seen issues like this with other performance monitoring tools either when the node/filer gets too busy (which is very unlikely in the case of the cDOT system we're trying to monitor) and/or the server hosting the tool gets too busy (again, doesn't seem likely here).
Just wondering if anyone has run into something similar and/or if the community has an pointers as to where we should look. I've attached a sample graph of what we're seeing if that helps. The spotty datapoints have been circled (since they can be hard to pick out). Since these two volumes are in the same SVM and the metric category is the same, I wouldn't suspect that they somehow have different sampling rates - and depending on the volume there are times the metrics that are spotty on some will be consistent/continuous on others.
Thanks!
Chris
Solved! See The Solution
- Mark as New
- Bookmark
- Subscribe
- Mute
- Subscribe to RSS Feed
- Permalink
- Report Inappropriate Content
Hi,
I suspect you have very low IOP volumes and the "latency_io_reqd" squelch is kicking in. From the Harvest admin guide:
latency_io_reqd
Latency metrics can be inaccurate if the IOP count is low. This
parameter sets a minimum number of IOPs required before a
latency metric will be submitted and can help reduce confusion
from high latency but low IOP situations. Supported for volumes
and QoS instances only.
If you set this parameter to 0 then latency values will never be supressed - so no spotty data - but you may also see more latency outliers due to low accuracy seen when IOP count is low.
Set to 0, restart the pollers, and share if you think the result is better or worse than the default.
Cheers,
Chris Madden
Storage Architect, NetApp EMEA (and author of Harvest)
Blog: It all begins with data
If this post resolved your issue, please help others by selecting ACCEPT AS SOLUTION or adding a KUDO
- Mark as New
- Bookmark
- Subscribe
- Mute
- Subscribe to RSS Feed
- Permalink
- Report Inappropriate Content
Hello and thank you for bringing this issue up.
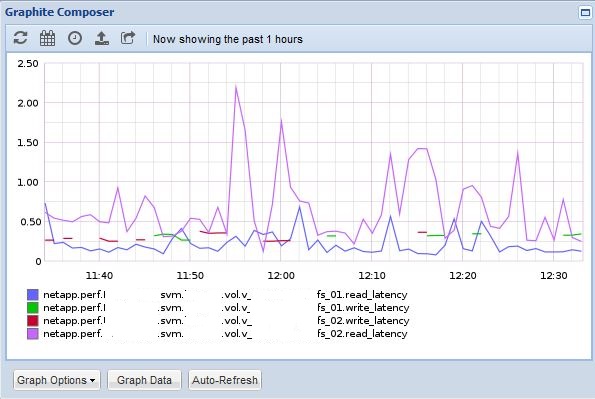
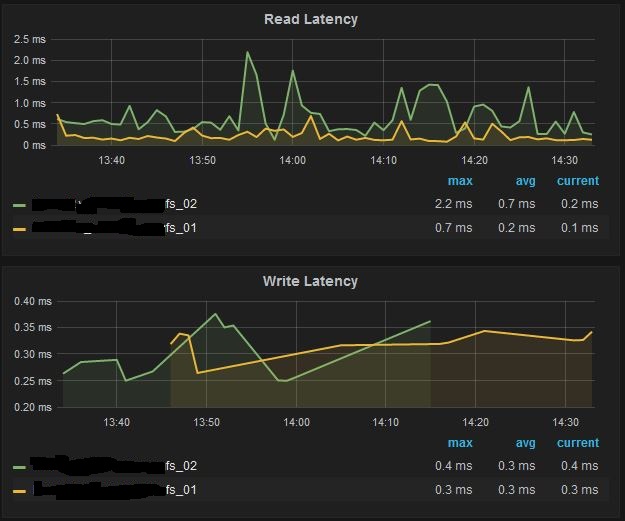
we have a similar situation here - i've watched this on individual svm volume stats in graphite/grafana - especially with write latency ...
the View in graphite ...
and here in grafana
are these issues due to 'holes' in the datarows or with processing of harvest?
the log of this poller looks pretty clean:
[2016-04-26 18:21:44] [NORMAL ] Poller status: status, secs=14400, api_time=645, plugin_time=7, metrics=203492, skips=0, fails=0
[2016-04-26 22:21:44] [NORMAL ] Poller status: status, secs=14400, api_time=646, plugin_time=7, metrics=195650, skips=0, fails=0
[2016-04-27 02:21:44] [NORMAL ] Poller status: status, secs=14400, api_time=651, plugin_time=7, metrics=194791, skips=0, fails=0
[2016-04-27 06:21:44] [NORMAL ] Poller status: status, secs=14400, api_time=646, plugin_time=7, metrics=196353, skips=0, fails=0
[2016-04-27 10:21:44] [NORMAL ] Poller status: status, secs=14400, api_time=648, plugin_time=8, metrics=208015, skips=0, fails=0
[2016-04-27 14:21:44] [NORMAL ] Poller status: status, secs=14400, api_time=649, plugin_time=7, metrics=209007, skips=0, fails=0
our monitoring interval is 1 minute
thank you for sharing your Informations:-)
yours
Martin Barth
- Mark as New
- Bookmark
- Subscribe
- Mute
- Subscribe to RSS Feed
- Permalink
- Report Inappropriate Content
Hi,
I suspect you have very low IOP volumes and the "latency_io_reqd" squelch is kicking in. From the Harvest admin guide:
latency_io_reqd
Latency metrics can be inaccurate if the IOP count is low. This
parameter sets a minimum number of IOPs required before a
latency metric will be submitted and can help reduce confusion
from high latency but low IOP situations. Supported for volumes
and QoS instances only.
If you set this parameter to 0 then latency values will never be supressed - so no spotty data - but you may also see more latency outliers due to low accuracy seen when IOP count is low.
Set to 0, restart the pollers, and share if you think the result is better or worse than the default.
Cheers,
Chris Madden
Storage Architect, NetApp EMEA (and author of Harvest)
Blog: It all begins with data
If this post resolved your issue, please help others by selecting ACCEPT AS SOLUTION or adding a KUDO
- Mark as New
- Bookmark
- Subscribe
- Mute
- Subscribe to RSS Feed
- Permalink
- Report Inappropriate Content
Hello,
Thanks for the response. I did some spot checking and built some graphs with read/write ops and then read/write latency. Sure enough, if the operation count in question drops below ~5 or so, the corresponding latency number gets spotty. Since my original graph is of our Exchange cluster, it's doing mostly reads with a handful of rights - therefore the read latency is consistent and the write latency metric falls off from time to time. I then did some checking against our Splunk cluster (which is doing 99% writes) and it has consistent write latency numbers but hardly ever gets read_ops high enough to trigger a latency metric.
We'll play around with that latency_io_reqd and see what we get back.
Thanks again!
Chris
- Mark as New
- Bookmark
- Subscribe
- Mute
- Subscribe to RSS Feed
- Permalink
- Report Inappropriate Content
Hello Chris!
Thank you for your 'enlightening' answer - your description and hint to the harvest documentation does the trick 🙂
you're the best - thank you for your excellent work with netapp-harvest - it's a charm watching these graphs 🙂
yours,
Martin Barth
- Mark as New
- Bookmark
- Subscribe
- Mute
- Subscribe to RSS Feed
- Permalink
- Report Inappropriate Content
Hi Chris
I'm using Harvest to monitor vscan latency cDOT systems. What I have noticed is that this parameter “latency_io_reqd” does suppress the vscan latency. Harvest guide says the default value is 10. I’m not entirely sure how Harvest code works out this, but in our environment, before I set this to 0, the vscan scan latency is 0 before 8am, even though the scan base number is more than 10 (a few hundreds from time to time), the scan latency is 0 in grafana. After this is set to 0, we can see scan latency being captured completed for all times. So, maybe the default value to ignore low IOPS isn’t 10?
- Mark as New
- Bookmark
- Subscribe
- Mute
- Subscribe to RSS Feed
- Permalink
- Report Inappropriate Content
Hi @lisa5
I checked the code and the latency_io_reqd applies to any counter that has a property of ‘average’ and has ‘latency’ in the name. If this is true it then checks the base counter and it needs at least latency_io_reqd IOPs to report the latency. Keep in mind that the raw base counter is sometimes a delta value, like # of scans since last poll, so you must divide it by the elapsed time between polls to get the per second rate. Only if this rate is > 10 would latency be submitted. My experience is that very low IOP counters tend to have wacky latency figures that create distracting graphs and is why I added this feature. You can certainly set the latency_io_reqd = 0 to disable entirely. You could also run two pollers per cluster, one for only vscan and the other for the rest, with differing latency_io_reqd values. It could also be that I need to add a hard-coded exception for vscan latency if it is accurate even at very low op levels. When I add vscan support to Harvest I'll check this.
Hope this helps!
Cheers,
Chris Madden
Solution Architect - 3rd Platform - Systems Engineering NetApp EMEA (and author of Harvest)
Blog: It all begins with data
If this post resolved your issue, please help others by selecting ACCEPT AS SOLUTION or adding a KUDO or both!


