Active IQ Unified Manager Discussions
- Home
- :
- Active IQ and AutoSupport
- :
- Active IQ Unified Manager Discussions
- :
- Has the Harvest metrics list description in Grafana?
Active IQ Unified Manager Discussions
- Subscribe to RSS Feed
- Mark Topic as New
- Mark Topic as Read
- Float this Topic for Current User
- Bookmark
- Subscribe
- Mute
- Printer Friendly Page
- Mark as New
- Bookmark
- Subscribe
- Mute
- Subscribe to RSS Feed
- Permalink
- Report Inappropriate Content
Does anyone know such a document?
We want to confirm the meaning of each metric in Grafana.
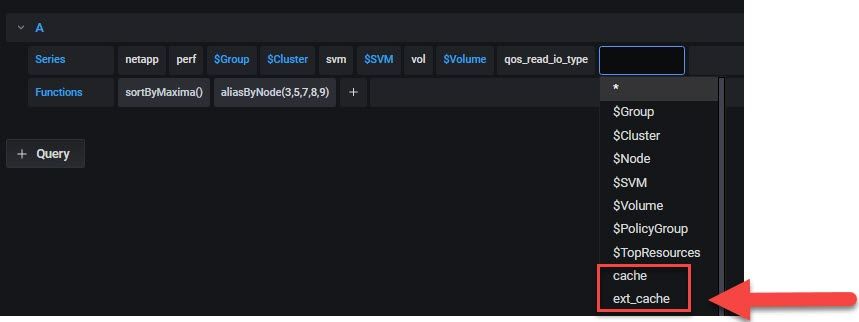
Below is a schematic diagram.
Solved! See The Solution
- Mark as New
- Bookmark
- Subscribe
- Mute
- Subscribe to RSS Feed
- Permalink
- Report Inappropriate Content
Hi GuoSyuan,
There is a utility that comes with Harvest 1.x which you can use to retrieve information about the counters. It's a little bit work, but most of the time you'll get all the details (in Harvest 2.0 we are working on a GUI that will simplify this, but it will take some time to be ready).
First, find out the "object" the counter belongs to (I'll explain that in a minute). Then, run the utility:
$ ./util/perf-counters-utility -host HOST -user USER -pass PASSWORD -c -f OBJECT
Replace HOST, USER and PASSWORD with the IP address, username and password of your cluster (this is used to retrieve the API info), and replace OBJECT with object (e.g. "volume", "system:node", "processor"... ). You should get a list of counters with detailed description.
How to find out the object? Most of the time, you can lookup a counter in Harvests' template. (e.g. "template/default/cdot-9.6.0.conf") and see under which object they are listed. Unfortunately, some counters are cooked by the plugins, so you have to either guess their origin or lookup in the plugin sourcecode. This is the case with the counter "qos_read_io_type" that I see in your screenshot: it is cooked from the counter "read_io_type" from -- I think -- the object "workload_volume". So I would run:
$ ./util/perf-counters-utility -host HOST -user USER -pass PASSWORD -c -f workload_volume
to get info about the counter. Hope this somehow helps!
- Mark as New
- Bookmark
- Subscribe
- Mute
- Subscribe to RSS Feed
- Permalink
- Report Inappropriate Content
@vachagan_gratian
Thanks for your help. That utility is help.
The utility used the parameter "-o" for the "display object list" and got the ext_cache description below.
ext_cache: This object lists global WAFL External Cache state information applicable to the entire software subsystem, not specific to a given type of cache.
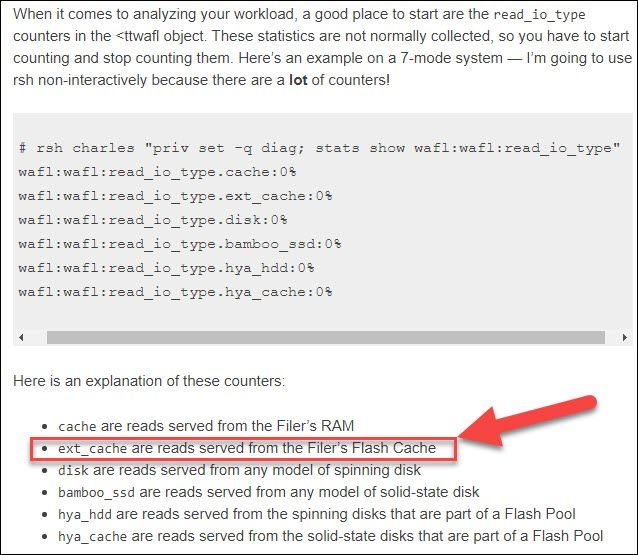
Does the "External Cache" mean Flash Cache (PAM card or NVRAM)?
Is this tool the same as the "statistics catalog object show" command?
I have found a web-site explanation of these counters, the reference as below.
https://bitpushr.wordpress.com/category/performance/
Have any document for these counters item explanation by NetApp?
- Mark as New
- Bookmark
- Subscribe
- Mute
- Subscribe to RSS Feed
- Permalink
- Report Inappropriate Content
Yes the statistics catalog command will explain the CMA object:instance:counter descriptions. Some counters are not used for customer consumption, and we generally don't have customers poking around in there.
Is there something specific you need?
- Mark as New
- Bookmark
- Subscribe
- Mute
- Subscribe to RSS Feed
- Permalink
- Report Inappropriate Content
Thanks vachagan_gratian and paul_stejskal for the prompt reply.
We understand that these data are the same as the output by the statistics catalog command, we also learned Harvest-Utility could use to get the metrics list and more information.
We are looking for some counter and index making dashboard to quickly check
1. Hardware health (ex: Interconnect-Switch-Power; Network Port Status; CRC error count ...etc.)
2. Effective performance of health (Is only need to look at volume latency? or any suggested?)
3. Space and performance indicators confirm expansion requirements
Are there any suggested indicators?
- Mark as New
- Bookmark
- Subscribe
- Mute
- Subscribe to RSS Feed
- Permalink
- Report Inappropriate Content
Latency is the primary metric as far as performance. Anything else is secondary.


