Options
- Subscribe to RSS Feed
- Mark Topic as New
- Mark Topic as Read
- Float this Topic for Current User
- Bookmark
- Subscribe
- Mute
- Printer Friendly Page
- Mark as New
- Bookmark
- Subscribe
- Mute
- Subscribe to RSS Feed
- Permalink
- Report Inappropriate Content
Hello,
In Netapp Management Console we can report the top 5 busiest disk through a graph for a selected period of time.
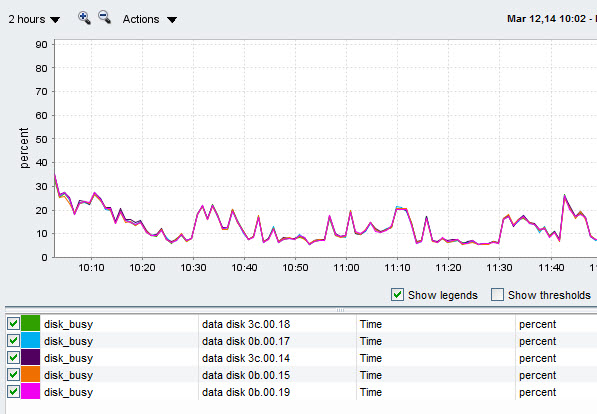
Would anyone know how to report the same way for all the disk in an aggregate?
(Not the table format on Operation Manager, unless there is a graph option over there)
Thanks,
Gilles
3 REPLIES 3
- Mark as New
- Bookmark
- Subscribe
- Mute
- Subscribe to RSS Feed
- Permalink
- Report Inappropriate Content
Under Manage Performance click on Physical (instead of Logical) and you will see the aggregates.
- Mark as New
- Bookmark
- Subscribe
- Mute
- Subscribe to RSS Feed
- Permalink
- Report Inappropriate Content
Hello,
Thanks for that, in fact the screenshot is a part of this view but this show only the 5 top busiest disk, not all unfortunately.
Thanks,
Gilles
- Mark as New
- Bookmark
- Subscribe
- Mute
- Subscribe to RSS Feed
- Permalink
- Report Inappropriate Content
I don’t know the command but you should be able to user DFM cli command to pull this data for a particular time frame.
You also use statit, disk busy percentage and latency.
