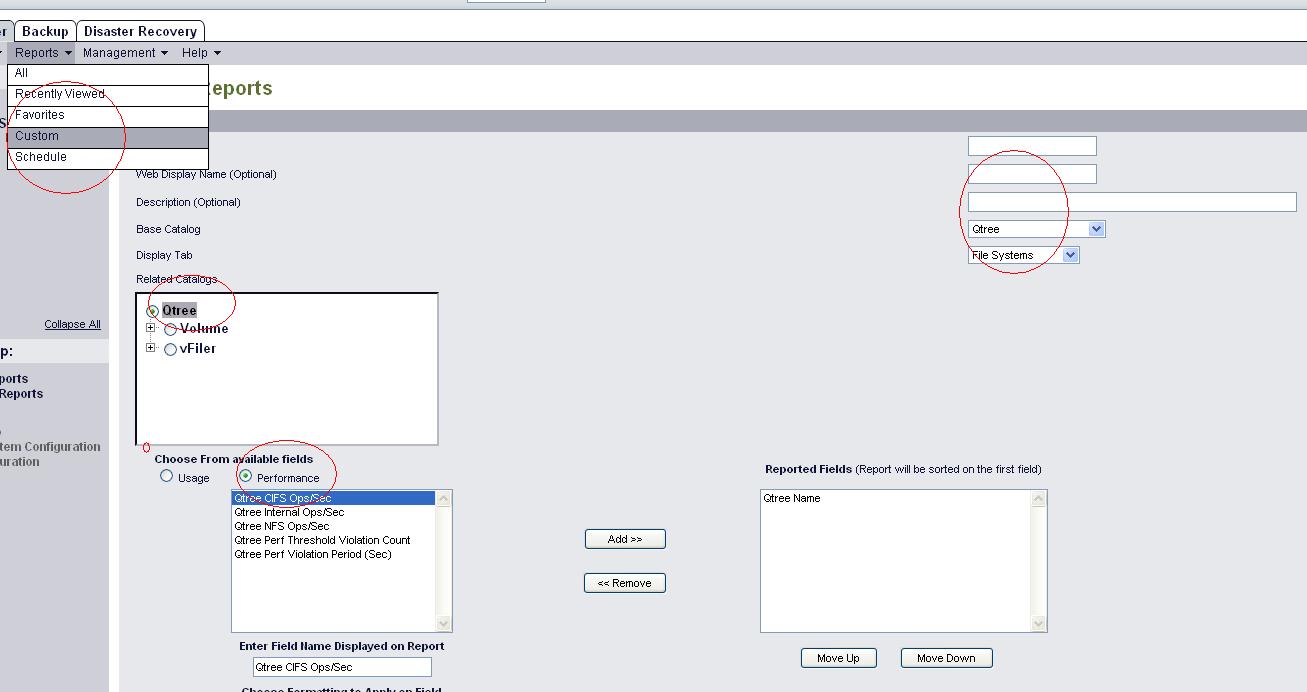
You can create a custom report as shown in the attached image.
If you want to get the data for a specific time period you can use the below command.
[root@lnx-dfm]# dfm perf data retrieve help
NAME
retrieve -- This command allows you to extract the counter data
with supported statistical calculations on them.
SYNOPSIS
dfm perf data retrieve { [ -o object-name-or-id ... ] [ -C perf-counter ... ]
[ -V view-name ] }
[ -d duration ] [ -b start-time ] [ -e end-time ]
[ -M month ... ] [ -D weekday ... ] [ -T time-range ... ]
[ -m statistical-method [ -P percentile-value ]
[ -S data-advance-method ] ]
[ -s sample-rate ] [ -x output-format ] [ -R ]
DESCRIPTION
This command retrieves performance data for the specified counters and
object instances. These counters and instances can be specified explicitly
using the -C and -o options or implicitly by specifying the view-name
using -V option.
When the view specified is associated with object types, the object
instance has to be explicitly specified using the -o option. When the view
specified is associated with object instances, this option is not
mandatory. If -o option is specified in this case, the specified object
instances are considered, ignoring the instances in the view. If
counters are explicitly specified along with the view, the counters
in the view are ignored and the explicitly specified counters are
considered instead.
For finer control on the time, a filter with months, days and time
range with in a day can be specified. Only those time stamps that
satisfy the filter will be shown in the output. On the resulting output of
counter data, statistical computations like minimum, maximum, mean,
and value_at_percentile can be computed.
