Active IQ Unified Manager Discussions
- Home
- :
- Active IQ and AutoSupport
- :
- Active IQ Unified Manager Discussions
- :
- lmgr_ndosmb3_op graphs in harvest
Active IQ Unified Manager Discussions
- Subscribe to RSS Feed
- Mark Topic as New
- Mark Topic as Read
- Float this Topic for Current User
- Bookmark
- Subscribe
- Mute
- Printer Friendly Page
- Mark as New
- Bookmark
- Subscribe
- Mute
- Subscribe to RSS Feed
- Permalink
- Report Inappropriate Content
Hi
I have cDOT 8.2.3P3 FAS3250
The other days, Panic Reboot occur.
The answer from NetAppsupport is Burt#901008
I want to obtain lock-create.total value in the lmgr_ndosm3_op stats send counter with harvest
How can I collect it?
thanks.
Solved! See The Solution
- Mark as New
- Bookmark
- Subscribe
- Mute
- Subscribe to RSS Feed
- Permalink
- Report Inappropriate Content
Hi Chris
You are amazing!
I can predict when to panic reboot, Because you helped me.
It will take time to Upgrade cDOT8.2.4 or later.
Before 1.5 million, to cDOT8.2.4 or later planninng.
Thanks.
- Mark as New
- Bookmark
- Subscribe
- Mute
- Subscribe to RSS Feed
- Permalink
- Report Inappropriate Content
Hi @hashiya1112
First, in the 8.2 family this bug is fixed in 8.2.4 and later so updating ONTAP is the best option. If that isn't possible the next best thing is to monitor.
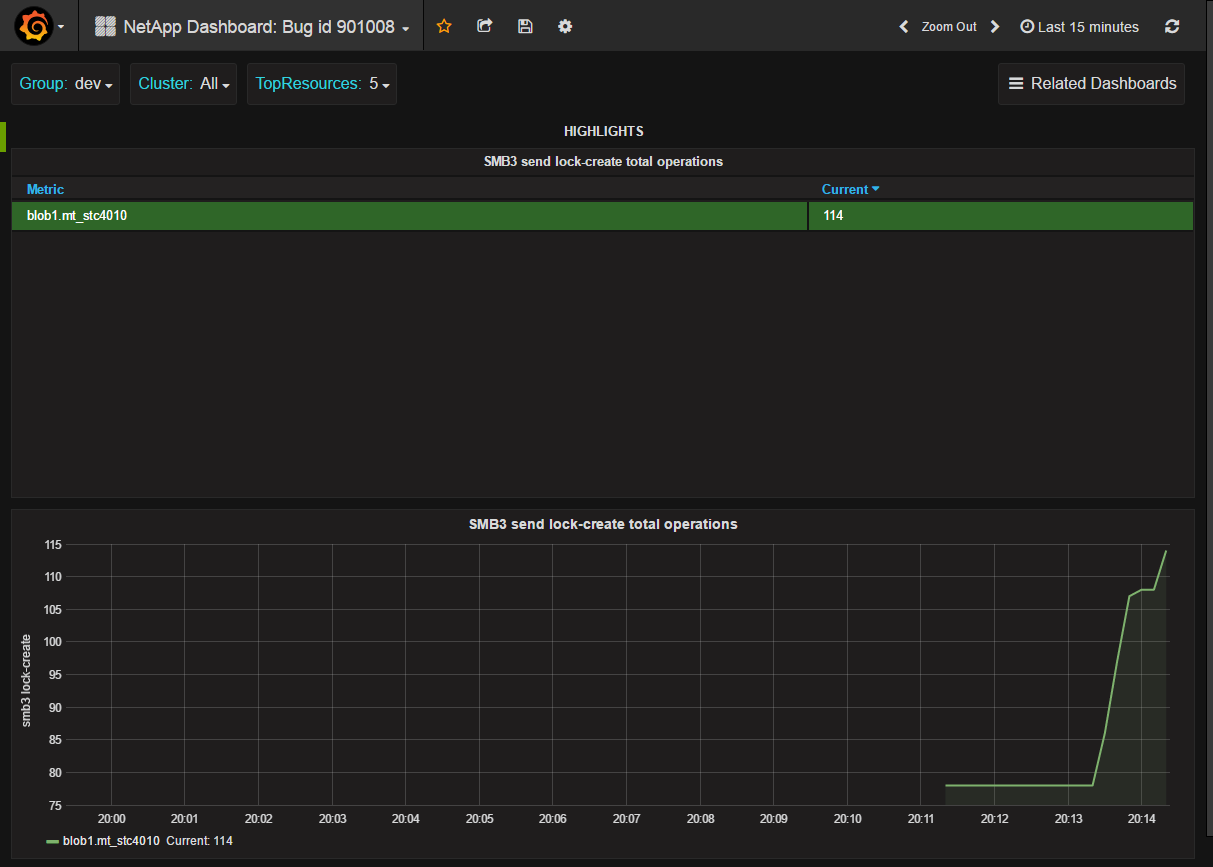
I created a collection template and grafana dashboard to visualize it like this:
This metric is the send lock-create total operations as mentioned in the bug. If the number is >1.5 million you should do a proactive reboot.
To set this up see the zip file here:
These files are to visualize bug id 901008 (http://mysupport.netapp.com/NOW/cgi-bin/bol?Type=Detail&Display=901008)

ATTN: You must use NetApp Harvest v1.3 or later!

1) Copy the conf file to /opt/netapp-harvest/template

2) Add collection of a new template to capture the additional counter needed by editing your netapp-harvest.conf poller entry for
 the cluster where you want to enable the extra counter by setting:
template = bug-id-901088.conf,default

So an entry which includes these counters might look like:
[clus1]
hostname = 192.168.22.2
group = AMS
template = default,bug-id-901088.conf

3) Restart the poller /opt/netapp-harvest/netapp-manager -restart

4) In the Grafana GUI choose the dashboard list and then import. Select the json file and load it. Within a few minutes
 you should see metrics arriving.
Let me know how this works for you!
Cheers,
Chris Madden
Solution Architect - 3rd Platform - Systems Engineering NetApp EMEA (and author of Harvest)
Blog: It all begins with data
If this post resolved your issue, please help others by selecting ACCEPT AS SOLUTION or adding a KUDO or both!
- Mark as New
- Bookmark
- Subscribe
- Mute
- Subscribe to RSS Feed
- Permalink
- Report Inappropriate Content
Hi Chris
You are amazing!
I can predict when to panic reboot, Because you helped me.
It will take time to Upgrade cDOT8.2.4 or later.
Before 1.5 million, to cDOT8.2.4 or later planninng.
Thanks.
- Mark as New
- Bookmark
- Subscribe
- Mute
- Subscribe to RSS Feed
- Permalink
- Report Inappropriate Content
Chris - Looking to get lock count (vserver locks show output count, basically) graphing for all clusters in our harvest 1.4 instance. Ontap 9.1p3 sources. This post seems like it would get us most of the way there, but the link to the zip files in dropbox is dead. Can you point me to the current source for the zip?
- Mark as New
- Bookmark
- Subscribe
- Mute
- Subscribe to RSS Feed
- Permalink
- Report Inappropriate Content
Hi @Brian-C
I do not know the current link.
But I have a file.
It is possible to send source code with private message to you.
thanks

