Hi everyone,
Got a question about Grafana dashboards from Netapp-Harvest; After importing the json and selecting the datasource, I need to create all the queries manually for each panel. Is it normal ? I thought that would come pre-defined... I don't have much experience with grafana.
Example for write latency panel. Query is empty...

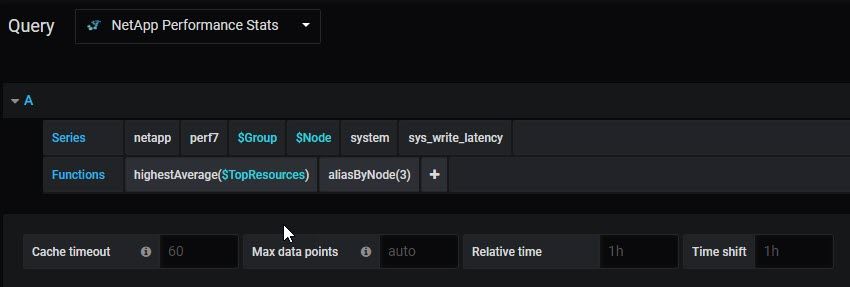
After completing the query manually:

I must build all the query manually ?
The 1st dashboard i'm working with is the following: db_netapp-dashboard-7-mode-group.json
It looks like some more recent dashboards like "db_netapp-detail-snapmirror.json" is having all the queries pre-defined..
Running harvest v1.6 , grafana v6.3.5
Thanks!
Martin.