This site will enter Read Only mode on July 23 as we prepare to move to a new platform. You will still be able to view content, but posting and replying will be temporarily disabled.
We're excited to launch our new Community experience on July 30 and more information will follow soon.
Stay connected during the transition - Join our Discord community today.
Network and Storage Protocols
- Home
- :
- ONTAP, AFF, and FAS
- :
- Network and Storage Protocols
- :
- Re: Volume IOPs monitoring in NetApp 6210 and 3170
Network and Storage Protocols
- Subscribe to RSS Feed
- Mark Topic as New
- Mark Topic as Read
- Float this Topic for Current User
- Bookmark
- Subscribe
- Mute
- Printer Friendly Page
- Mark as New
- Bookmark
- Subscribe
- Mute
- Subscribe to RSS Feed
- Permalink
- Report Inappropriate Content
Hi,
I want to monitor my NetApp 6210 and 3170 SAN storage. I am pretty much done with everything. I am using open source third party NMS and doing SNMP based monitoring of my storage infrastructure. i am struck at below points:
1. Number of IOPs per volume.
2. Aggregate number of IOPs on all volumes.
3. Number of IOPs on each physical disk.
Prompt response in this regard will be highly appreciated.
Regards,
Riaz...
- Mark as New
- Bookmark
- Subscribe
- Mute
- Subscribe to RSS Feed
- Permalink
- Report Inappropriate Content
You can use NetApp "stats" command which is available in the Data ONTAP on any filer.
You can find out the available measureable objects on the filer by entering:
step1:
toaster>stats list objects
As you are initerested in 'lun', 'volume' & 'aggr' related stats, you can see them listed among objects listed by the previous command.
To see 'counters' available for the objects listed in step1:
step2:
toaster>stats list counters volume
Counters for object name: volume
instance_name
node_name
instance_uuid
vserver_name
vserver_uuid
avg_latency
total_ops
read_data
read_latency
read_ops
write_data
write_latency
write_ops
other_latency
other_ops
toaster>stats list counters lun
Counters for object name: lun
instance_name
node_name
display_name
read_ops
write_ops
other_ops
read_data
write_data
queue_full
avg_latency
total_ops
avg_read_latency
avg_write_latency
avg_other_latency
queue_depth_lun
toaster> stats list counters aggregate
Counters for object name: aggregate
instance_name
node_name
total_transfers
user_reads
user_writes
cp_reads
user_read_blocks
user_write_blocks
cp_read_blocks
total_transfers_hdd
user_reads_hdd
user_writes_hdd
cp_reads_hdd
user_read_blocks_hdd
user_write_blocks_hdd
cp_read_blocks_hdd
total_transfers_ssd
user_reads_ssd
user_writes_ssd
cp_reads_ssd
user_read_blocks_ssd
user_write_blocks_ssd
cp_read_blocks_ssd
You can go one step further and determine what instances are available for the object; say ' volume'. The instances are basically the volumes available on that filer.
toaster>stats list instances volume
Instances for object name: volume
vol0
vol_QT_CIFS
vol_show
centos_iscsi
cl_test_clone_centos_iscsi_20130204124118
vol_dell
centos_nfs
vol_iscsi_win_test
Now, Start system statistics gathering in the background using '-I' as identifier. For example: To observe stats for volume 'vol_iscsi_win_test':
step3:
toaster> stats start -I volstats volume:vol_iscsi_win_test
Note:volstats is just the name I have given, you can give any meaningful name as you like.
To see the results while I/O is in progress:
toaster> stats show -I volstats
StatisticsID: volstats
volume:vol_iscsi_win_test:instance_name:vol_iscsi_win_test
volume:vol_iscsi_win_test:node_name:
volume:vol_iscsi_win_test:instance_uuid:368fa20c-6263-11e2-ad8d-123478563412
volume:vol_iscsi_win_test:vserver_name:
volume:vol_iscsi_win_test:vserver_uuid:
volume:vol_iscsi_win_test:avg_latency:4926032.41us
volume:vol_iscsi_win_test:total_ops:8/s
volume:vol_iscsi_win_test:read_data:0b/s
volume:vol_iscsi_win_test:read_latency:0us
volume:vol_iscsi_win_test:read_ops:0/s
volume:vol_iscsi_win_test:write_data:494556b/s
volume:vol_iscsi_win_test:write_latency:5479065.05us
volume:vol_iscsi_win_test:write_ops:7/s
volume:vol_iscsi_win_test:other_latency:8969.92us
volume:vol_iscsi_win_test:other_ops:0/s
Note:I am running these commands on my simulator, so dont read too much into the vaules here.
To stop the background stats and print the result on the console, enter:
toaster>stats stop -I volstats
Similarly for LUNS:
toaster> stats list instances lun
Instances for object name: lun
/vol/vol_iscsi_win_test/iometer-BWKgW]BaIqNQ
/vol/cl_test_clone_centos_iscsi_20130204124118/lun_centos_0-BWKgW]BaIqOk
/vol/centos_iscsi/lun_centos_0-BWKgW]BaIqOA
/vol/centos_iscsi/lun_centos_1-BWKgW]BaIqOC
/vol/cl_test_clone_centos_iscsi_20130204124118/lun_centos_1-BWKgW]BaIqOl
/vol/centos_iscsi/lun_centos-BWKgW]BaIqNE
/vol/cl_test_clone_centos_iscsi_20130204124118/lun_centos-BWKgW]BaIqOj
toaster>stats start -I lun_stats lun:/vol/vol_iscsi_win_test/iometer-BWKgW]BaIqNQ
toaster>stats show -I lun_stats
toaster>stats stop -I lun_stats
There is alreay a wonerful blog post on this matter:
Performance "stats" without PerfStat or Ops Mgr:
https://communities.netapp.com/groups/chris-kranz-hardware-pro/blog/2009/04/01/performance-stats-without-perfstat-or-ops-mgr
- Mark as New
- Bookmark
- Subscribe
- Mute
- Subscribe to RSS Feed
- Permalink
- Report Inappropriate Content
Hi,
Thanks for your response.
What i want to do is. i want to have IOPs for each volume as separate and aggregate by using a third party NMS (Zabbix) via SNMP. I need to know the OID's and MIBs which i can download and can do the needful.
Regards,
Riaz..
- Mark as New
- Bookmark
- Subscribe
- Mute
- Subscribe to RSS Feed
- Permalink
- Report Inappropriate Content
IOPS, and latency, etc are not available via snmp, only via the Ontap API.
Roll your own, or go with something that has this built in and automated. (e.g. http://www.logicmonitor.com/monitoring/storage/netapp-filers/)
- Mark as New
- Bookmark
- Subscribe
- Mute
- Subscribe to RSS Feed
- Permalink
- Report Inappropriate Content
Hi Steve,
I can have IOPs per protocol level i.e. Number of IOPs on NFS, iSCSI and FC but i wanna have IOPs per volume level. I think if i can have at protocol level then there must be some way out for volume level as well.
- Mark as New
- Bookmark
- Subscribe
- Mute
- Subscribe to RSS Feed
- Permalink
- Report Inappropriate Content
You would think. But unfortunately it's not true. 🙂
Having been through the NetApp MIBs comprehensivley several times, I can state categorically there is no way to get per volume IOps or latency.
Stuff like this:
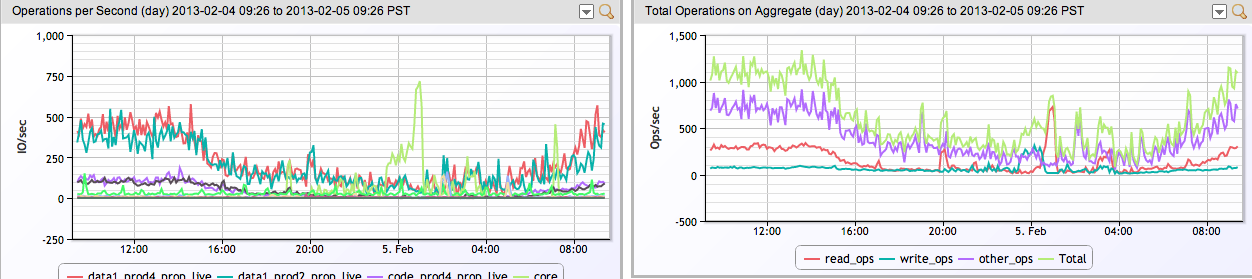
can only be gotten via the API.
(The above is from logicmonitor).
