This site will enter Read Only mode on July 23 as we prepare to move to a new platform.
You will still be able to view content, but posting and replying will be temporarily disabled.
To learn more, please review the information in this blog post.
ONTAP Discussions
- Home
- :
- ONTAP, AFF, and FAS
- :
- ONTAP Discussions
- :
- Re: Available IOps on the aggregate
ONTAP Discussions
- Subscribe to RSS Feed
- Mark Topic as New
- Mark Topic as Read
- Float this Topic for Current User
- Bookmark
- Subscribe
- Mute
- Printer Friendly Page

- Mark as New
- Bookmark
- Subscribe
- Mute
- Subscribe to RSS Feed
- Permalink
- Report Inappropriate Content
Hello,
I want to ask if there is any tool which can be run for checking the aggregate IO availability?
1. I tried to add cluster on NetApp Synergy but there is no information about available IOps.
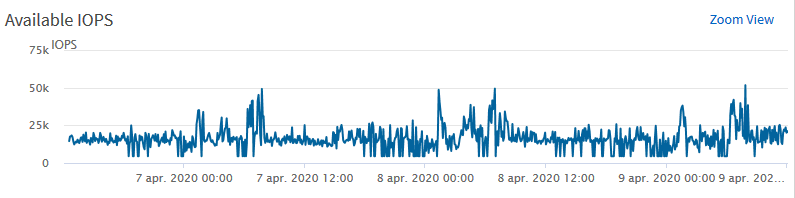
2. On Active IQ I can see graphs which is called available IO but for me its a little bit unclear. Available IOPS is growing when some more traffic is on the environment, how should I read it?
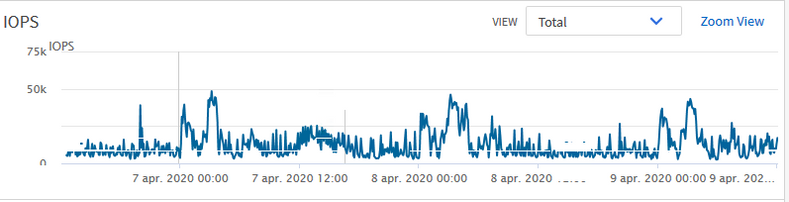
Comparing to IOPS on the environment:
3. I can also count it manually based on individual disk max. IO but I think it will be not quite real information because total IO depends also on other parameters, not just individual drives.
I am looking for just simple answer what are the IOps capabilities on my customer's environment (IO per TB, IO per aggregate or etc.).
Thank you for any suggestions.
Solved! See The Solution


- Mark as New
- Bookmark
- Subscribe
- Mute
- Subscribe to RSS Feed
- Permalink
- Report Inappropriate Content
- Mark as New
- Bookmark
- Subscribe
- Mute
- Subscribe to RSS Feed
- Permalink
- Report Inappropriate Content
note: Synergy is no more, it will redirect to Fusion.
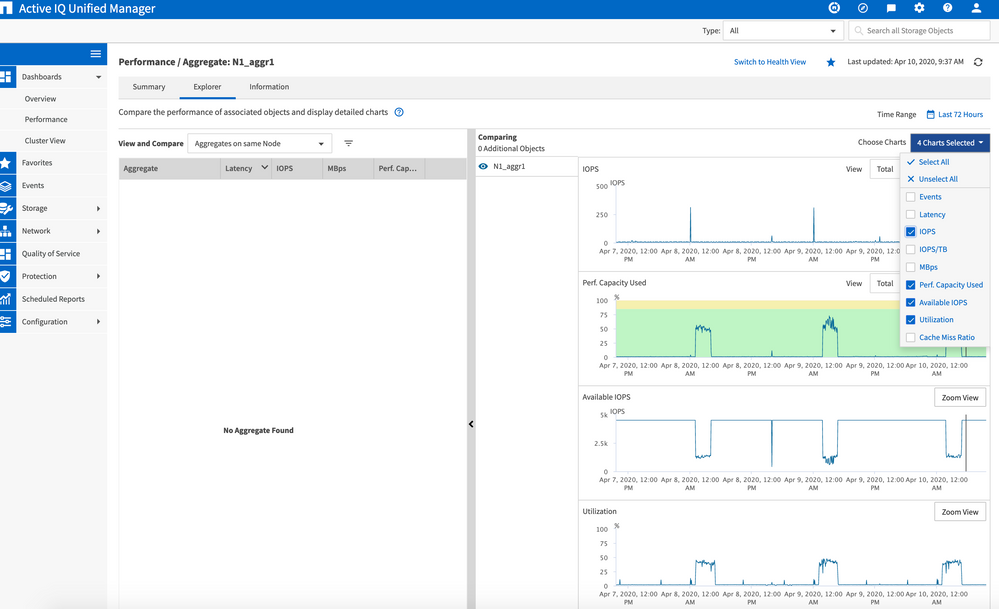
Check out the Perf Capacity of the system?
There's a graph in AIQUM (Active IQ Unified Manager) that is helpful.


- Mark as New
- Bookmark
- Subscribe
- Mute
- Subscribe to RSS Feed
- Permalink
- Report Inappropriate Content
Correct, Active IQ Unified Manager is the product you need: https://mysupport.netapp.com/site/products/all/details/activeiq-unified-manager/downloads-tab
- Mark as New
- Bookmark
- Subscribe
- Mute
- Subscribe to RSS Feed
- Permalink
- Report Inappropriate Content
Hello,
I have Active IQ installed in the system but I am not sure how to read graph which I pasted into my previous post.
How to read it? Maksimum available IOPS is 50k? Why availability is not corresponding to IO graph?
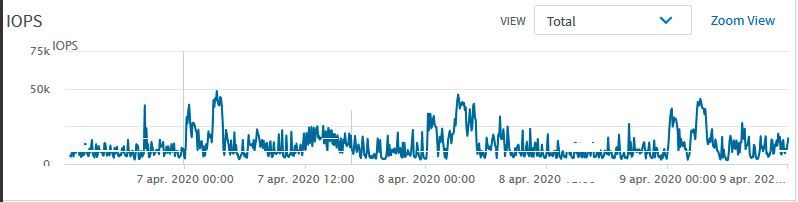
When IOPS are close to 0 availability graph should be approx 50k as I understand but it is not like that. Can you please explain?
- Mark as New
- Bookmark
- Subscribe
- Mute
- Subscribe to RSS Feed
- Permalink
- Report Inappropriate Content