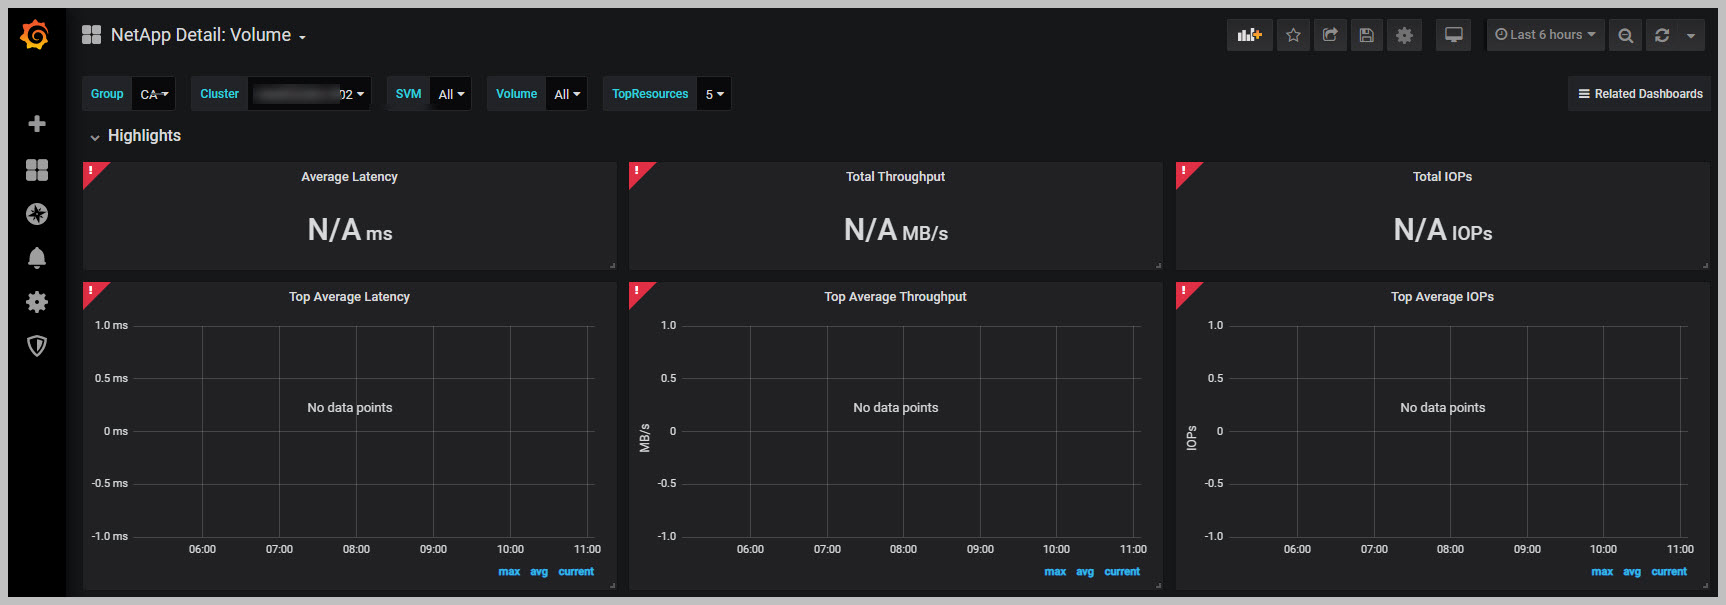
I have the following configuration and works fine but sometimes when I try to generate "volume" metric dashboard for a cluster which hold 100+ volumes I get blank graphs with "NA" to the left of the dashboard graph and sometimes it says "Templating Init Failed". I have saved a volume dashboard for one cluster after it is completely loaded and it works fine whenever I go back to that cluster dashboard but when I try to load other cluster which holds 100+ volumes the above error resurfaces. I dont think so it is optimal way of doing to save dashboard for volume metric for each and every cluster we have in the firm, I should be able to navigate to the required cluster / volume and see the graphs without any above errors right? am I hitting with any bug here?
When I wait for some time and hit refresh the graph will load nicely but its not loading for the first time.
Grafana version 6.3.3
NetApp-Harvest version 1.6.1
Carbon version 0.9.13
Django version 1.4.22
Graphite-Web version 0.9.13