ONTAP Discussions
- Home
- :
- ONTAP, AFF, and FAS
- :
- ONTAP Discussions
- :
- Re: High CPU Peaks in Grafana
ONTAP Discussions
- Subscribe to RSS Feed
- Mark Topic as New
- Mark Topic as Read
- Float this Topic for Current User
- Bookmark
- Subscribe
- Mute
- Printer Friendly Page
- Mark as New
- Bookmark
- Subscribe
- Mute
- Subscribe to RSS Feed
- Permalink
- Report Inappropriate Content
Some months ago we expand our 4 node Metrocluster with AFF700 to an 8 node Metrocluster. The Ontap version was 9.7P7 and since May 30th we have 9.7P13 running.
The Grafana is installed with this versions:
netapp-harvest-1.6-1.noarch
graphite2-1.3.10-1.el7_3.x86_64
grafana-5.2.4-1.x86_64
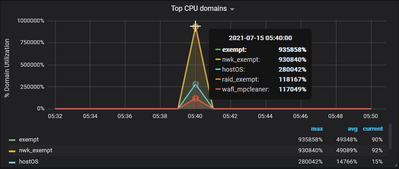
After this expansion one of the new nodes have very high (~20000%) CPU utilization for about 3-4 minutes. This peaks appear irregular. There are no other peaks from volumes or network during the same time, what could be the reason for this CPU peaks.
We opened a case and Netapp checked the Metrocluster, but everything is fine. They don't see in the perfomance data they have any CPU peaks or problems.
So we and Netapp think, the Grafana is not working fine or uses wrong performance data.
Here is a chart:
Does anyone here have similar problems or an idea what the reason could be.
We would be happy for any suggestions.
- Mark as New
- Bookmark
- Subscribe
- Mute
- Subscribe to RSS Feed
- Permalink
- Report Inappropriate Content
Install Active IQ Unified Manager as well
if two products pick up the spikes then it could be ontap but it could also be some bug in the performance data being provided
- Mark as New
- Bookmark
- Subscribe
- Mute
- Subscribe to RSS Feed
- Permalink
- Report Inappropriate Content
We already use Active IQ Unified Manager. There are no peaks. Do you know a BUG that could point to our problem?
Does anyone have an idea how we can find out what is wrong with our monitoring system?
- Mark as New
- Bookmark
- Subscribe
- Mute
- Subscribe to RSS Feed
- Permalink
- Report Inappropriate Content
If Active IQ Unified Manager report normal values and Harvest/Grafana doesn't, it would indicate an issue in the way Harvest/Grafana interpret the numbers and not an issue on the storage system
- Mark as New
- Bookmark
- Subscribe
- Mute
- Subscribe to RSS Feed
- Permalink
- Report Inappropriate Content
Thank you very much kahuna for your post.
I checked the whisper file nwk_exempt.wsp from the effected node
Thu Jul 15 05:39:00 CEST 2021>>> 104.09428531740799428462196374312043
Thu Jul 15 05:40:00 CEST 2021 >>> 930840.22062434302642941474914550781
Thu Jul 15 05:41:00 CEST 2021 >>> 143.93252139853800031232822220772505
and you can see, this value is exactly the same that grafana is presenting.
I wonder, where this high value is comming from.
Could the harvest default config be a reason? Do you know, where I can get one for cDot Ontap 9.7.P13?
In the last years we just copied the old one with the name of the new Ontap version, when we did an Ontap Update.
- Mark as New
- Bookmark
- Subscribe
- Mute
- Subscribe to RSS Feed
- Permalink
- Report Inappropriate Content
I see 2000000%, not 20000%
each CPU core can report up to 100% - 2000000% is impossible (even 20000% is)
There is something wrong with your monitoring tool
- Mark as New
- Bookmark
- Subscribe
- Mute
- Subscribe to RSS Feed
- Permalink
- Report Inappropriate Content
Hi @Andrea2, sorry for the late response.
The version of Harvest you are using is deprecated. We have a completely new version which is open-source and available here: https://github.com/NetApp/harvest
Would you consider to upgrade to the new version?
Regarding the issue you have, I fear this is a ZAPI issue specific to your ONTAP version. Could you run the following commands and share with us the results?
$ cd /opt/netapp-harvest
$ ./util/perf-counters-utility -host <HOST> -user <USER> -pass <PASSWORD> -f processor -d -n "*"
You should replace <HOST>, <USER>, <PASSWORD> with the hostname/IP of your cluster, username and password respectively.
- Mark as New
- Bookmark
- Subscribe
- Mute
- Subscribe to RSS Feed
- Permalink
- Report Inappropriate Content
- Mark as New
- Bookmark
- Subscribe
- Mute
- Subscribe to RSS Feed
- Permalink
- Report Inappropriate Content
Hi Jutta,
Apologies for the late response and thanks for the data.
I could not figure out what's wrong with the data, but we can try two things:
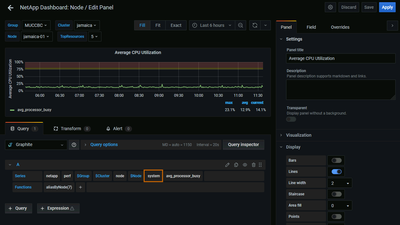
(1). In Grafana, can you open the graph editor and replace "processor" with "system" in the query as in the screenshot below? Harvest actually get's the same counter "avg_processor_busy" twice from ZAPI. One is pre-calculated by ONTAP (system.avg_processor_busy) and one is calculated by Harvest itself (processor.avg_processor_busy). Can you check if you still see the high peaks?
(2). For better debugging, can you send me the same data that you sent earlier, but twice? You'll need to run exactly same command, with a ~10 seconds interval in between.
- Mark as New
- Bookmark
- Subscribe
- Mute
- Subscribe to RSS Feed
- Permalink
- Report Inappropriate Content
Hello vachagan_gratian,
thank you very much for your response.
1) We changed the graph to "system" and now we don't see any peaks.
It seem's that the calculation from Harvest is not working fine. Do you have a more detailed explanation for this?
2) We run the command at an interval of 10 seconds (perfcounters1.txt and percounters2.txt)
Thank you.


