Active IQ Unified Manager Discussions
- Home
- :
- Active IQ and AutoSupport
- :
- Active IQ Unified Manager Discussions
- :
- Re: NetApp Harvest 1.6 snapmirror and NFS-connections dashboard
Active IQ Unified Manager Discussions
- Subscribe to RSS Feed
- Mark Topic as New
- Mark Topic as Read
- Float this Topic for Current User
- Bookmark
- Subscribe
- Mute
- Printer Friendly Page
- Mark as New
- Bookmark
- Subscribe
- Mute
- Subscribe to RSS Feed
- Permalink
- Report Inappropriate Content
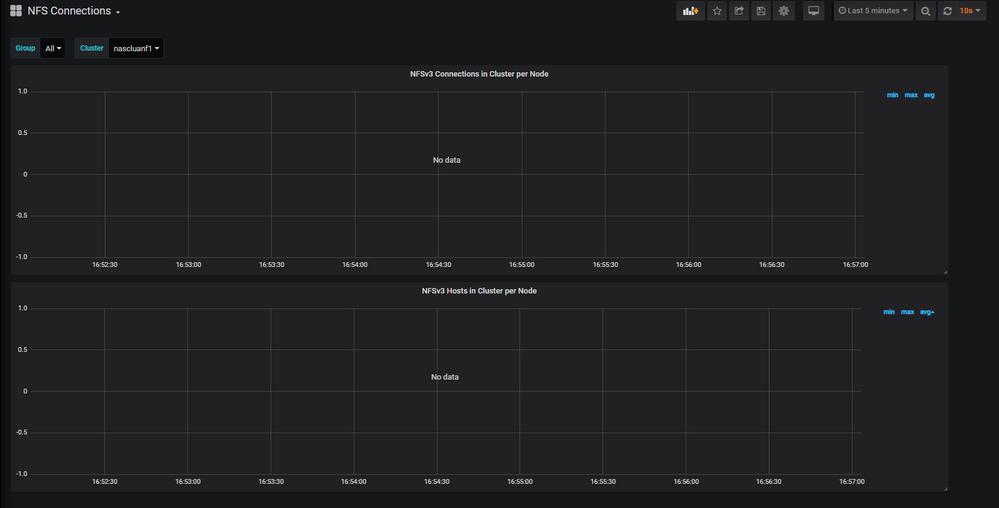
The NFS-connections and snapmirror dashboard is giving me this error.
- Mark as New
- Bookmark
- Subscribe
- Mute
- Subscribe to RSS Feed
- Permalink
- Report Inappropriate Content
This might be a Grafana backward compabilitiy issue of dashboard. What version do you have? If it's older than 5, I think updating Grafana might solve this for you.
- Mark as New
- Bookmark
- Subscribe
- Mute
- Subscribe to RSS Feed
- Permalink
- Report Inappropriate Content
I will look at that. I do get these error on the extension scripts...not sure if that impacts the dashboard. I would expect not as it should show an empty one at any rate.
snapmirror
[2019-11-08 11:24:00,511] [ERROR] [poll_snapmirrors] ZAPI request failed: [SSL: CERTIFICATE_VERIFY_FAILED] certificate verify failed (_ssl.c:618)
[2019-11-08 11:25:01,396] [ERROR] [poll_snapmirrors] ZAPI request failed: [SSL: CERTIFICATE_VERIFY_FAILED] certificate verify failed (_ssl.c:618)
[2019-11-08 11:26:00,793] [ERROR] [poll_snapmirrors] ZAPI request failed: [SSL: CERTIFICATE_VERIFY_FAILED] certificate verify failed (_ssl.c:618)
[2019-11-08 11:27:02,743] [ERROR] [poll_snapmirrors] ZAPI request failed: [SSL: CERTIFICATE_VERIFY_FAILED] certificate verify failed (_ssl.c:618)
i resolved the nfs-connections one.
[2019-11-08 10:30:41] [WARNING] [sshpass] not installed, can't run package [nfs-connections.sh], exiting
[2019-11-08 10:46:01] [WARNING] [sshpass] not installed, can't run package [nfs-connections.sh], exiting
[2019-11-08 11:01:01] [WARNING] [sshpass] not installed, can't run package [nfs-connections.sh], exiting
[2019-11-08 11:15:59] [WARNING] [sshpass] not installed, can't run package [nfs-connections.sh], exiting
[2019-11-08 11:31:03] [DEBUG ] Session started
[2019-11-08 11:31:03] [DEBUG ] Session ended
- Mark as New
- Bookmark
- Subscribe
- Mute
- Subscribe to RSS Feed
- Permalink
- Report Inappropriate Content
The Dashboard import error is unrelated to those ones.
Re: snapmirror
Are you using SSL authentication? Unfortunately that's not supported in the Extention Manager (although we are planning to support that sometime soon). For now you can use the extension packages user/password authentication.
Re: nfs-connections
Seems like the dependency sshpass is missing. (`apt install sshpass` will install it on a Debian-like system). If you already installed it, it might be the same authentication issue as above.
- Mark as New
- Bookmark
- Subscribe
- Mute
- Subscribe to RSS Feed
- Permalink
- Report Inappropriate Content
As we jump topics......
I ugraded to Grafana 6.4.4 and I still get the same error. Like the variable DS_GRAPHITE is not confgiured somewhere?
I am not using SSL authentication for any part of the Harvest environment. Seems like a python thing
#====== Polled host setup defaults ============================================
host_type = FILER
host_port = 443
host_enabled = 1
template = default
data_update_freq = 60
ntap_autosupport = 0
latency_io_reqd = 10
auth_type = password
- Mark as New
- Bookmark
- Subscribe
- Mute
- Subscribe to RSS Feed
- Permalink
- Report Inappropriate Content
Seems like I did something wrong when exporting the SnapMirror dashboard. The ${DS_GRAPHITE} is a variable name from my Grafana configuration and is not recognized by your Grafana server.
Here is a quick fix you can use:
- Navigate to the SnapMirror Replications dashboard and enter Dashboard settings (click on the gear icon on right top),
- Go to JSON Model and copy the code to a text editor
- Replace all "datasource": "${DS_GRAPHITE}" with "datasource": null
- Copy the code back, save and reload the dashboard.
cc @yannb
- Mark as New
- Bookmark
- Subscribe
- Mute
- Subscribe to RSS Feed
- Permalink
- Report Inappropriate Content
I upgraded grafana to 6.4 and harvest to 1.6, but not able to see any data for nfs connections .
I followed your post and changed datasource to null for both snapmirror relationships and nfs3 connections


- Mark as New
- Bookmark
- Subscribe
- Mute
- Subscribe to RSS Feed
- Permalink
- Report Inappropriate Content
Can you check the log files of these two extensions? If there isn't much there, can you run them in verbose mode and check the logs again.
To run in verbose mode, just restart the poller for which you have activated in these extensions with -v, e.g.:
./netapp-manager -restart -poller POLLER -v
Btw, I found a bug in the snapmirrors extensions (making it collect only destination metrics), I'll fix it and post an updated version here soon.
- Mark as New
- Bookmark
- Subscribe
- Mute
- Subscribe to RSS Feed
- Permalink
- Report Inappropriate Content
Hello,
Have you managed to use the Snapmirror and NFS Connection dashboards ?
Thanks !
- Mark as New
- Bookmark
- Subscribe
- Mute
- Subscribe to RSS Feed
- Permalink
- Report Inappropriate Content
I'm also hitting this issue with NFS Connections and Snapmirror Replications.
Any updates?
Chris
- Mark as New
- Bookmark
- Subscribe
- Mute
- Subscribe to RSS Feed
- Permalink
- Report Inappropriate Content
Same issue.
- Mark as New
- Bookmark
- Subscribe
- Mute
- Subscribe to RSS Feed
- Permalink
- Report Inappropriate Content
Datasource named ${DS_GRAPHITE} was not found
same issue any suggestion ?
- Mark as New
- Bookmark
- Subscribe
- Mute
- Subscribe to RSS Feed
- Permalink
- Report Inappropriate Content
- Mark as New
- Bookmark
- Subscribe
- Mute
- Subscribe to RSS Feed
- Permalink
- Report Inappropriate Content
Hi,
I believe that the link on how to manually fix the dashboard is wrong. Can you please advise if this is the case and update it with the correct one.
Thanks.
- Mark as New
- Bookmark
- Subscribe
- Mute
- Subscribe to RSS Feed
- Permalink
- Report Inappropriate Content
Grafana v6.5.3 Harvest 1.6
Thanks, @vachagan_gratian I was able to sort out the issue by following steps
1. Copy python module
Unzip netapp-manageability-sdk-9.7.zip (/tmp/netapp-manageability-sdk-9.7/lib/python/NetApp)
Copy these files NaElement.py NaErrno.py NaServer.py to /opt/netapp-harvest/lib
2. Update poller
# csgxxxxxxxx
[csgxxxxxx]
hostname = XXX.XX.XX.XX
group = XXX_cDot
template = default,extension.conf
3. Ignore SSL validation # due to error ZAPI request failed: [SSL: CERTIFICATE_VERIFY_FAILED] certificate verify failed (_ssl.c:618)
vi /opt/netapp-harvest/extension/snapmirror_replications.py
Add following red line after import logging & before def main();
import logging
import ssl
try:
_create_unverified_https_context = ssl._create_unverified_context
except AttributeError:
# Legacy Python that doesn't verify HTTPS certificates by default
pass
else:
# Handle target environment that doesn't support HTTPS verification
ssl._create_default_https_context = _create_unverified_https_context
def main():
4. Add privileges # ZAPI request failed: Insufficient privileges: user 'netapp-harvest' does not have read access to this resource
Add snapmirror show command to role
security login role create -role netapp-harvest-role -access readonly -cmddirname "snapmirror show"
5. Change all "datasource": null, from Snapmirror Replication Settings - JSON Model
${DS_GRAPHITE} to "datasource": null
Then Refresh Browser
- Mark as New
- Bookmark
- Subscribe
- Mute
- Subscribe to RSS Feed
- Permalink
- Report Inappropriate Content
Going to try the above fix but the initial fix provided certainly doesn't work.
On saving the dashboard you get Datasource named null was not found when you make the initial fix.
- Mark as New
- Bookmark
- Subscribe
- Mute
- Subscribe to RSS Feed
- Permalink
- Report Inappropriate Content
@mmorshed11 thanks a lot for this info! I forgot to mention that you have to extend the ONTAP user privileges (the bad habit of always testing with an admin user...).
The reason you only see destination snapmirrors in your Grafana is a bug in the extension. I recommend getting the recent updater to fix this (this will create a backup and overwrite your modified extension).
As for 3, I am surprised you go this error, what Python version was running the process?
- Mark as New
- Bookmark
- Subscribe
- Mute
- Subscribe to RSS Feed
- Permalink
- Report Inappropriate Content
@vachagan_gratian wrote:
The reason you only see destination snapmirrors in your Grafana is a bug in the extension. I recommend getting the recent updater to fix this (this will create a backup and overwrite your modified extension).
I've run the updater on a new installation and can confirm that while the dashboard templating issues are resolved, I'm still only seeing data on the destination relationships per node panel for the snapmirror replications dashboard. Is there any way to confirm that the update applied correctly? Running it again hasn't had any impact.
So far all that I'm seeing in the logs are the following entries repeated in each logfile:
cluster1
[ERROR] [poll_nodes] ZAPI request failed: For volume object, no instances were found to match the given query.
cluster2
[WARNING] [poll_snapmirrors] Destination relationship with no node or volume. Skipping
[WARNING] [poll_snapmirrors] Source relationship with no volume. Skipping
[ERROR] [poll_nodes] ZAPI request failed: For volume object, no instances were found to match the given query.
cluster3
[INFO] [poll_snapmirrors] No Snapmirror replications on this cluster, stopping session
i currently have the following snapmirrors:
- 1 from cluster 2 to cluster 1
- 2 from cluster 3 to cluster 1
- 11 from clster 1 to cluster 2
- Mark as New
- Bookmark
- Subscribe
- Mute
- Subscribe to RSS Feed
- Permalink
- Report Inappropriate Content
Excuse me for the nubi question:
1. Do i need to configure a seperate cron job for this script, or will the overall script which deals with the other collection take care of this?
2. Regarding params for this script:
when running it I get at the end "[2020-05-24 08:11:20,762] [DEBUG] [send_to_graphite] Skipping send: no graphite root defined". Do I need to input manually the graphite, user,pass info? Or will it inherit the info?
- Mark as New
- Bookmark
- Subscribe
- Mute
- Subscribe to RSS Feed
- Permalink
- Report Inappropriate Content
Hi,
1. No need for that, the extensions are started and managed by Harvest 1.6. You only need to check the specific dependencies of each extension itself. (E.g. in case of the SnapMirrors extension, the Python package of NetApp SDK is required).
2. You get the message because you started the extension in foreground. When it's normally started in the background, all required parameters are passed on by Harvest 1.6 as environment variables.
Let me know if you have more questions!
Vachagan
- Mark as New
- Bookmark
- Subscribe
- Mute
- Subscribe to RSS Feed
- Permalink
- Report Inappropriate Content
Can we get an updated link to download the extension files?

