Active IQ Unified Manager Discussions
- Home
- :
- Active IQ and AutoSupport
- :
- Active IQ Unified Manager Discussions
- :
- Re: QOS Policy Group counters? Harvest/Grafana/Graphite json file?
Active IQ Unified Manager Discussions
- Subscribe to RSS Feed
- Mark Topic as New
- Mark Topic as Read
- Float this Topic for Current User
- Bookmark
- Subscribe
- Mute
- Printer Friendly Page
QOS Policy Group counters? Harvest/Grafana/Graphite json file?
- Mark as New
- Bookmark
- Subscribe
- Mute
- Subscribe to RSS Feed
- Permalink
- Report Inappropriate Content
I am looking to get a detailed performance view of named QOS policy groups rather than just the name of the volume on Grafana. I've installed the Harvest/Grafana/Graphite OVA along with the NetApp dashboards. I am looking to create or find a dashboard the lists each QOS policy by name. Below is an image of the QOS drilll down but it lists the volume and does not tell me what QOS policy group it has been assigned. If I could see performance based on the group name that woul be great. any sugestions?
Solved! See The Solution
- Mark as New
- Bookmark
- Subscribe
- Mute
- Subscribe to RSS Feed
- Permalink
- Report Inappropriate Content
Hi,
I haven't created any default dashboards for stats at the policy group level but they are collected by default.
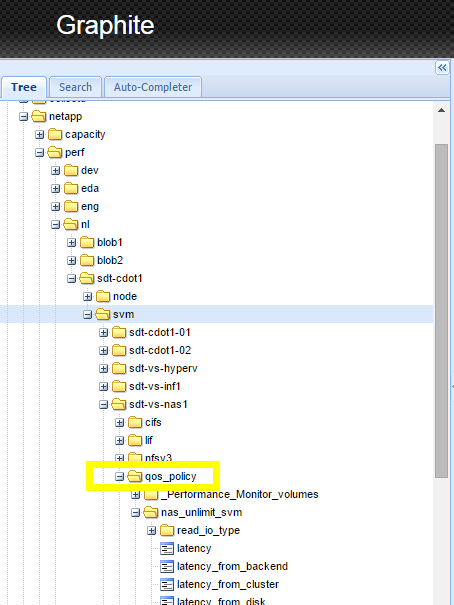
Here I can show them in the native Graphite GUI:
So you could 'save as' from the 'volume' dashboard to a new QOS Policy Group dashboard and then edit a bit to show these.
Hope that helps!
Cheers,
Chris Madden
Storage Architect, NetApp EMEA (and author of Harvest)
Blog: It all begins with data
P.S. Please select “Options” and then “Accept as Solution” if this response answered your question so that others will find it easily!
- Mark as New
- Bookmark
- Subscribe
- Mute
- Subscribe to RSS Feed
- Permalink
- Report Inappropriate Content
aaahhh. I see why I was having so many issues. Are there counters I need to add or anything like that? That counter is missing on my set-up. I've installed the ADVA-64 OVA which runs the v1.2.2 verion of Harvest. Thanks
- Mark as New
- Bookmark
- Subscribe
- Mute
- Subscribe to RSS Feed
- Permalink
- Report Inappropriate Content
I'm also polling CDOT Realease 8.2.1
- Mark as New
- Bookmark
- Subscribe
- Mute
- Subscribe to RSS Feed
- Permalink
- Report Inappropriate Content
Okay. You can disregard my last question. I figured it out. While we have named QOS policies we have not set limits on most of them. Most are set to unlimited for the time being as we gather baselines. Once a limit has been set (like 1000 iops) a counter will be measured against the specified policy.
This ,of course, is probably a well known fact already so I will just be quiet now. 🙂
- Mark as New
- Bookmark
- Subscribe
- Mute
- Subscribe to RSS Feed
- Permalink
- Report Inappropriate Content
Hi,
Actually, if you create a QoS policy group, and then modify resources (SVM or vol or lun or file) into it, then IO to those resources will roll-up to the policy group level. Also, if using OPM with Data ONTAP 8.2 it will will automatically assign any volume which has no policy group to the _performance_monitor_volumes policy group. This policy group has no limit and is there so that we get workload tracking of each volume so OPM can do it's magic. So if you don't see a qos_policy folder inside an SVM I suspect either (a) you have no IO occurring in the SVM or (b) the vols are not assigned to a policy group (which would be odd since OPM should do that!).
Hope that helps!
Cheers,
Chris
- Mark as New
- Bookmark
- Subscribe
- Mute
- Subscribe to RSS Feed
- Permalink
- Report Inappropriate Content
I've got a related question here...we've been able to add latency from qos policies to our Dashboards, but I can't seem to find the metric for the VALUE assigned in the QoS Policy. Ideally we'd like to represent that on the IOPS/Throughput graphs to visually show the "headroom" or to quickly see where the visible workload is in relation to the limits placed on them. Does this metric exist, or can it be added?
- Mark as New
- Bookmark
- Subscribe
- Mute
- Subscribe to RSS Feed
- Permalink
- Report Inappropriate Content
The throttle limit (iops and/or throughput) is not something collected right now. There isn't a counter for it so I'd have to hard code something in netapp-worker. Also, throttles are applied per policy group and since multiple objects (volumes, luns, etc) can be added to a single policy group I could only report on it at the policy group level, not the object (volune/lun/etc) level. Would tracking at the policy group level still be sufficient? The other thing I advise people is to check the 'latency from throttle' graphs to see if any workloads are hitting their limit. But, the downside of this technique is you can't see how close you are to the limit, only once you hve hit it and latency is being added to keep you from exceeding it.
Cheers,
Chris Madden
Storage Architect, NetApp EMEA (and author of Harvest)
Blog: It all begins with data
If this post resolved your issue, please help others by selecting ACCEPT AS SOLUTION or adding a KUDO or both!
- Mark as New
- Bookmark
- Subscribe
- Mute
- Subscribe to RSS Feed
- Permalink
- Report Inappropriate Content
Yep, you hit the nail on the head - we would LIKE to be able to display the limit fro mthe object level, but that would require a join-type function since the relationship is object -> policy -> limit. If ONTAP doesn't have the counter directly attached to the object is there a way to do a join-style lookup to display it?
We're using the Latency from Throttle now and while it is handy, it doesn't go quite as far as we'd like yet. AFAIK OCPM nor OCI can display this either.
- Mark as New
- Bookmark
- Subscribe
- Mute
- Subscribe to RSS Feed
- Permalink
- Report Inappropriate Content
I will add this to the feature request backlog.
At the policy group level I could send metrics like:
throttle_limit_throughput: configured limit
throttle_limit_iops: configured limit
throttle_remaining_throughput: (configured limit - current throughput)
throttle_remaining_iops: (configured limit - current throughput)
And at the object level I could send:
throttle_limit_throughput: configured limit (if applied to only one object, otherwise not sent)
throttle_limit_iops: configured limit (if applied to only one object, otherwise not sent)
throttle_remaining_throughput: (configured limit - current throughput)
throttle_remaining_iops: (configured limit - current throughput)
Would that work? Any better ideas?
Cheers,
Chris Madden
Storage Architect, NetApp EMEA (and author of Harvest)
Blog: It all begins with data
If this post resolved your issue, please help others by selecting ACCEPT AS SOLUTION or adding a KUDO or both!
- Mark as New
- Bookmark
- Subscribe
- Mute
- Subscribe to RSS Feed
- Permalink
- Report Inappropriate Content
Those sound like great ways to visualize the QoS limits and "headroom"
So what I imagine is a single graph for an object that shows the limit and current usage (likely stacked to easily see the delta) and a different graph showing the remaining values (declining or bottom feeders would be bad) - all filtered by the object selected above them.
Now if we can just get the OnCommand tools (OCPM and/or OCI) to be able to alert on thresholds using these same values, we'd be in business. Than you for the help visualizing the data for troubleshooting!
- Mark as New
- Bookmark
- Subscribe
- Mute
- Subscribe to RSS Feed
- Permalink
- Report Inappropriate Content
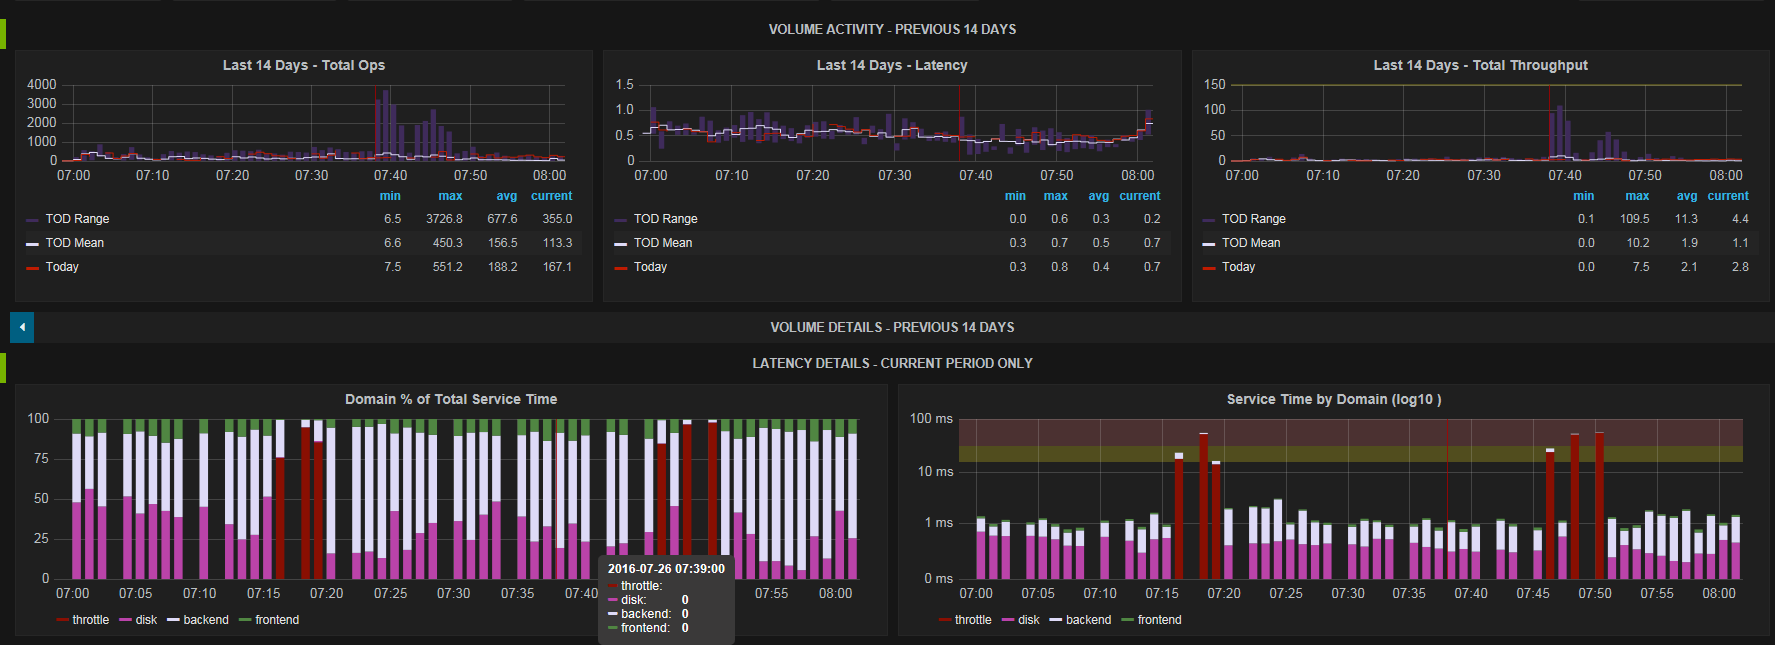
The attached dashboard is useful in seeing the impact of QoS policies on volume I/O, and current volume I/O relative to the past 2 weeks.
It shows the range of activity and the mean for iops/latency/throughput by time of day for the past N days. It superimposes the current day/period's values on this and then shows the latency breakdown by these service centers. I use this to demonstrate to users, the impact that a given qos policy is having on their volume(s).
Since we're adding to your feature request list Chris, what I'd find really useful is to be able to add to this dashboard would be:
- Number of samples in which latency_from_throttle (DELAY_CENTER_QOS_LIMIT) is non-zero in a given period of X samples.
- Either aggregated by harvest into a rate of some sort, or just a counter that I could do T2 - T1 to get a value for a period.
- IE: The number of minutes in which some throttling of the volume has taken place over the range in question.
[EDIT] It turns out that we can do this in graphite using built in functions because of a piece of grade school math that I should have remembered before posting. SUM / AVG = COUNT
We DO have sum and avg functions in Graphite.
A: summarize(netapp.perf.$Group.$Cluster.svm.$SVM.vol.$Volume.qos_latency_from_throttle, '1h', 'sum', false)
B: summarize(netapp.perf.$Group.$Cluster.svm.$SVM.vol.$Volume.qos_latency_from_throttle, '1h', 'avg', false)
C: alias(divideSeries(#A, #B), 'Throttled samples')
I'm still amazed by how much we can do using Harvest + Graphite.
- Mark as New
- Bookmark
- Subscribe
- Mute
- Subscribe to RSS Feed
- Permalink
- Report Inappropriate Content
Thanks for the dashboard. I'm new to customzing Graphana, any help on why all of the 14 day graphs have this error? The current period ones work great.
TypeError: reduce() of empty sequence with no initial value
- Mark as New
- Bookmark
- Subscribe
- Mute
- Subscribe to RSS Feed
- Permalink
- Report Inappropriate Content
That error message is what happens when the summarize function is called with an empty series.
I was running an older version of graphite / grafana, so just to test if my dashboard was broken in newer versions I've done an upgrade. Everything is working fine on my end so:
1) I uploaded a bad copy of the dashboard when I filtered out some site specific template values.
2) The dashboard was being called with no series. Try resetting each of the template values at the top and re-saving your dashboard, and select a volume to which a QoS policy has been applied.
I've removed the old copy of the dashboard, and re-attached it here, with the addition of of a couple other panels I'm testing.


