Hi,
I have developed a report which have 3 sections: Trending Line chart by month, Capacity Bar Chart (Total, used and unused) and List by arrays.
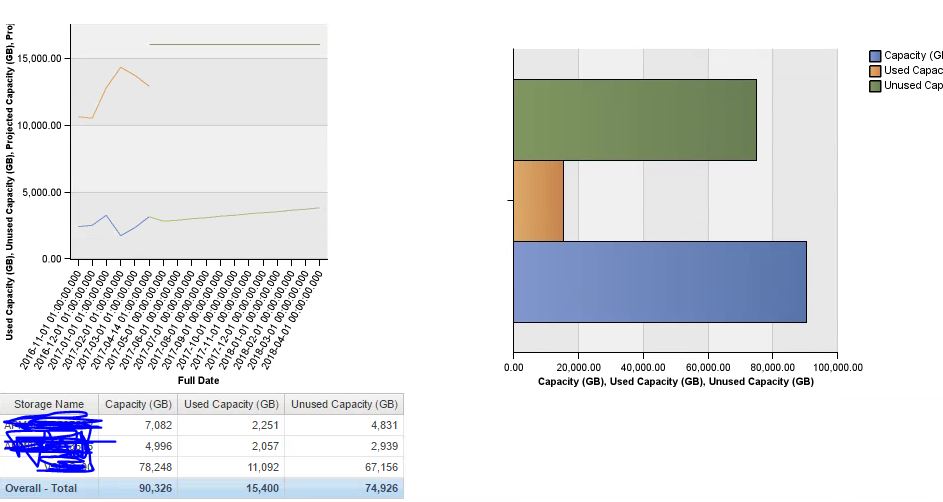
It was working fine for some time, till some days back. User started complaining that capacity shown in reports are 2 or more times the original capacity which was shown in earlier reports and there was no addition of disks on those arrays.
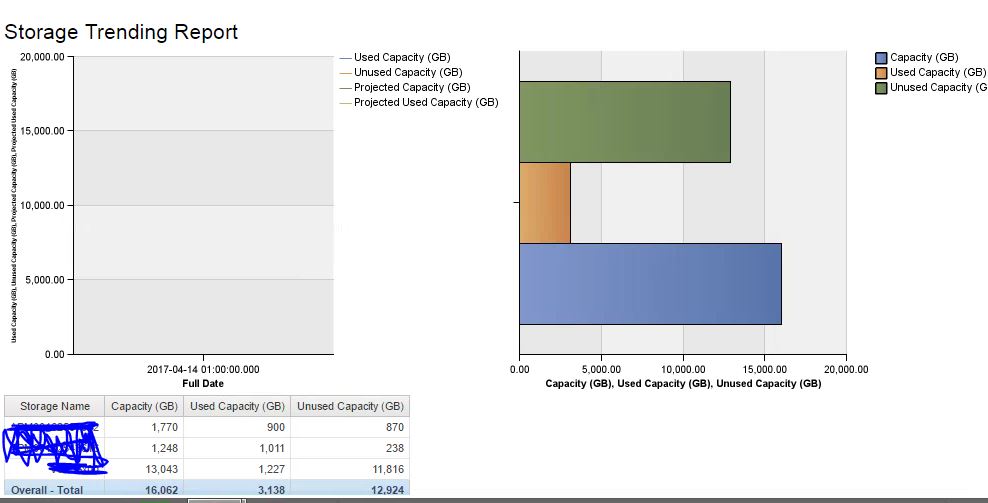
During analysis I found that there are multiple firmware versions of those arrays and users then confirmed that they have upgraded firmware. So to fix that double counting capacity I decided to use latest date filter in the report. It fixed the capacity in list but broke the trending chart. Now after putting filter, instead of showing all months past and projection, it is only showing latest month.
So what can be done that report show only latest data in list but read historical info to create trending chart.
Attaching here is XML copy of that report and 2 report output snapshots with and without using latest date filter.
I am using OCI 7.2.3 and Storage and Storage Pool Capacity DM.
