This site will enter Read Only mode on July 23 as we prepare to move to a new platform. You will still be able to view content, but posting and replying will be temporarily disabled.
We're excited to launch our new Community experience on July 30 and more information will follow soon.
Stay connected during the transition - Join our Discord community today.
Active IQ Unified Manager Discussions
- Home
- :
- Active IQ and AutoSupport
- :
- Active IQ Unified Manager Discussions
- :
- Re: Unified Manager metrics vs grafana and netapp harvest
Active IQ Unified Manager Discussions
- Subscribe to RSS Feed
- Mark Topic as New
- Mark Topic as Read
- Float this Topic for Current User
- Bookmark
- Subscribe
- Mute
- Printer Friendly Page
- Mark as New
- Bookmark
- Subscribe
- Mute
- Subscribe to RSS Feed
- Permalink
- Report Inappropriate Content
We've only had grafana setup with harvest 1.4 for a little while and I'm noticing a difference the iops for volume seems way off compared to ocum. For example I have one volume thats showing anaverage of 7.7k iops over the last 24 ours, but ocum sees an average of 2.5k iops over the last 24 hours. I'm trying to figure out which one is correct, I would think ocum, but I have a qos policy on this volume and it seems to be pretty close to the 8k max iops policy I have set.
Solved! See The Solution
- Mark as New
- Bookmark
- Subscribe
- Mute
- Subscribe to RSS Feed
- Permalink
- Report Inappropriate Content
@vachagan_gratian Thoughts ?
I would zoom in and compare a small time sample, it might be explained by the granularity of Harvest campared to OCUM, which only works on a 5 minutes sample, but even then it shouldn't be that different.
Also check the type of IOPS considered in OCUM. I remember sometimes it didn't show other_ops, but I checked now on a 7.2 version and it actually does.
- Mark as New
- Bookmark
- Subscribe
- Mute
- Subscribe to RSS Feed
- Permalink
- Report Inappropriate Content
OCUM documentation says that those performance values are averaged over the last 72 hours, might that be the reason of the difference? (I couldn't find out if they include other_ops in the total value, but that's a good point Yan!).
In either case, Harvest gives us the exact values that are reported by the CM of the ONTAP system.
- Mark as New
- Bookmark
- Subscribe
- Mute
- Subscribe to RSS Feed
- Permalink
- Report Inappropriate Content
Thanks, guys, that's where I was leaning to from what I've read, it just seems to be a bit much since the same 24-hour graphs in both systems look relatively flat so I thought it was odd.
- Mark as New
- Bookmark
- Subscribe
- Mute
- Subscribe to RSS Feed
- Permalink
- Report Inappropriate Content
The difference is indeed too large to be neglected. Could you maybe send me a sceenshot of both dashboards? I'll try to investigate this when I find a bit of time.
- Mark as New
- Bookmark
- Subscribe
- Mute
- Subscribe to RSS Feed
- Permalink
- Report Inappropriate Content


- Mark as New
- Bookmark
- Subscribe
- Mute
- Subscribe to RSS Feed
- Permalink
- Report Inappropriate Content
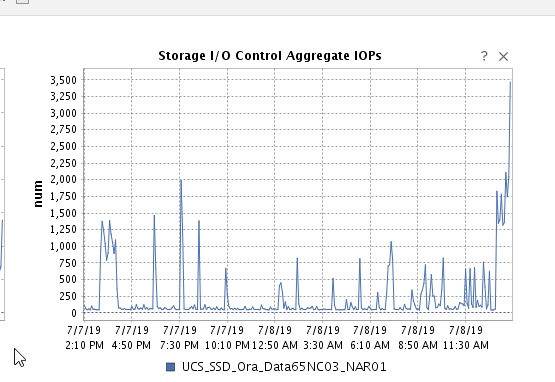
Thanks, even the drawn out lines looks similar they are just about 5k off.
- Mark as New
- Bookmark
- Subscribe
- Mute
- Subscribe to RSS Feed
- Permalink
- Report Inappropriate Content
- Mark as New
- Bookmark
- Subscribe
- Mute
- Subscribe to RSS Feed
- Permalink
- Report Inappropriate Content
Never mind ocum in another screen shows the 20k, now I just need to figure out why my qos policies aren't working.

- Mark as New
- Bookmark
- Subscribe
- Mute
- Subscribe to RSS Feed
- Permalink
- Report Inappropriate Content
Thanks for the update and screens. Let us know if you need further help.
