Active IQ Unified Manager Discussions
- Home
- :
- Active IQ and AutoSupport
- :
- Active IQ Unified Manager Discussions
- :
- Re: netapp-harvest
Active IQ Unified Manager Discussions
- Subscribe to RSS Feed
- Mark Topic as New
- Mark Topic as Read
- Float this Topic for Current User
- Bookmark
- Subscribe
- Mute
- Printer Friendly Page
- Mark as New
- Bookmark
- Subscribe
- Mute
- Subscribe to RSS Feed
- Permalink
- Report Inappropriate Content
HTTP Error
Internal Server Error
I can not get havest to connect to my datastore.
Solved! See The Solution
- Mark as New
- Bookmark
- Subscribe
- Mute
- Subscribe to RSS Feed
- Permalink
- Report Inappropriate Content
Yes! You have data flowing in now!! I would restart it now without the verbose (-v) flag.
Cheers,
Chris Madden
Storage Architect, NetApp EMEA (and author of Harvest)
Blog: It all begins with data
If this post resolved your issue, please help others by selecting ACCEPT AS SOLUTION or adding a KUDO or both!
- Mark as New
- Bookmark
- Subscribe
- Mute
- Subscribe to RSS Feed
- Permalink
- Report Inappropriate Content
It sounds like your Graphite/Grafana server is not setup correctly. Have you checked the troubleshooting steps in the Quick Start guide?
If you can check the logfiles (see the quick start guide) and share a more detailed error message maybe someone can help with how to fix.
Cheers,
Chris Madden
Storage Architect, NetApp EMEA (and author of Harvest)
Blog: It all begins with data
If this post resolved your issue, please help others by selecting ACCEPT AS SOLUTION or adding a KUDO or both!
- Mark as New
- Bookmark
- Subscribe
- Mute
- Subscribe to RSS Feed
- Permalink
- Report Inappropriate Content
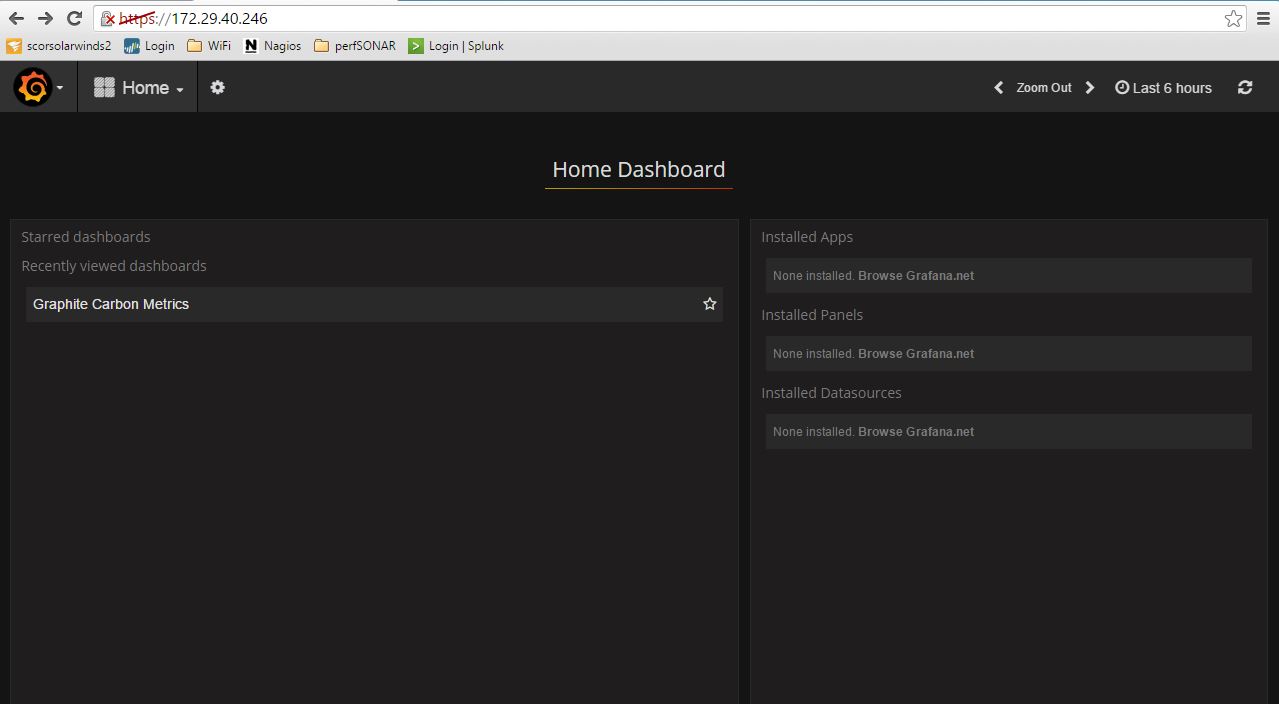
I've been through both guides numerious times. My import seems to work, however look at the attached screenshot.
root@Netappharvest1:/home/ddurand# cat /var/log/grafana/grafana.log
2016/06/14 07:55:44 [I] Completed 172.29.40.40 admin "GET /logout HTTP/1.1" 302 Found 29 bytes in 1378us
2016/06/14 08:10:21 [I] Completed 172.29.40.40 admin "GET /api/dashboards/db/new-dashboard HTTP/1.1" 404 Not Found 33 bytes in 872us
2016/06/14 09:27:31 [I] Completed 172.29.40.40 admin "GET /api/datasources/5 HTTP/1.1" 404 Not Found 35 bytes in 1214us
root@Netappharvest1:/home/ddurand# cat /var/log/carbon/listener.log.2016_6_8
08/06/2016 07:25:51 :: MetricLineReceiver connection with 127.0.0.1:47796 established
08/06/2016 07:25:51 :: MetricLineReceiver connection with 127.0.0.1:47796 closed cleanly
root@Netappharvest1:/home/ddurand# /opt/netapp-harvest/netapp-manager -import
[OK ] Will import dashboards to http://172.29.40.246:443
[OK ] Imported dashboard [db_netapp-dashboard-7-mode-group.json] successfully
[OK ] Imported dashboard [db_netapp-detail-disk-and-cache-layers.json] successfully
[OK ] Imported dashboard [db_netapp.json] successfully
[OK ] Imported dashboard [db_netapp-detail-7-mode-disk-and-cache-layers.json] successfully
[OK ] Imported dashboard [db_netapp-detail-7-mode-network-port.json] successfully
[OK ] Imported dashboard [db_netapp-detail-volume.json] successfully
[OK ] Imported dashboard [db_netapp-dashboard-cluster.json] successfully
[OK ] Imported dashboard [db_netapp-detail-7-mode-windows-file-services.json] successfully
[OK ] Imported dashboard [db_netapp-detail-graphite-server.json] successfully
[OK ] Imported dashboard [db_netapp-dashboard-svm.json] successfully
[OK ] Imported dashboard [db_netapp-dashboard-node.json] successfully
[OK ] Imported dashboard [db_netapp-dashboard-cluster-group.json] successfully
[OK ] Imported dashboard [db_netapp-detail-harvest-poller.json] successfully
[OK ] Imported dashboard [db_netapp-detail-network-lif.json] successfully
[OK ] Imported dashboard [db_netapp-detail-7-mode-volume.json] successfully
[OK ] Imported dashboard [db_netapp-detail-7-mode-lun.json] successfully
[OK ] Imported dashboard [db_netapp-detail-lun.json] successfully
[OK ] Imported dashboard [db_netapp-detail-network-port.json] successfully
[OK ] Imported dashboard [db_netapp-dashboard-7-mode-node.json] successfully
- Mark as New
- Bookmark
- Subscribe
- Mute
- Subscribe to RSS Feed
- Permalink
- Report Inappropriate Content
root@Netappharvest1:/home/ddurand# /opt/netapp-harvest/netapp-manager -import [OK ] Will import dashboards to http://172.29.40.246:443
Looks like a mismatch in red. In netapp-harvest.conf try setting grafana_url parameter to use https. You are not alone in this mismatch have already updated netapp-manager to be more helpful in case (it will be in the next release) and will also update the quickstart defaults to match the harvest user guide example syntax.
Hope that solves your issue!
Cheers,
Chris Madden
Storage Architect, NetApp EMEA (and author of Harvest)
Blog: It all begins with data
If this post resolved your issue, please help others by selecting ACCEPT AS SOLUTION or adding a KUDO or both!
- Mark as New
- Bookmark
- Subscribe
- Mute
- Subscribe to RSS Feed
- Permalink
- Report Inappropriate Content
Okay, I changed that up and received this:
root@Netappharvest1:/home/ddurand# /opt/netapp-harvest/netapp-manager -import
[OK ] Will import dashboards to https://172.29.40.246
[ERROR ] Failed to import dashboard [db_netapp-dashboard-7-mode-group.json] due to error: 401 Unauthorized
[ERROR ] -Response was :{"message":"Invalid API key"}
- Mark as New
- Bookmark
- Subscribe
- Mute
- Subscribe to RSS Feed
- Permalink
- Report Inappropriate Content
My guess is something went wrong with your copy/paste of the API key from the Grafana Web UI and pasted as the value for the grafana_api_key variable in the netapp-harvest.conf file. I would create a new API key in Grafana and apply it again being sure the entire string is copy/pasted.
Hope this helps.
Cheers,
Chris
- Mark as New
- Bookmark
- Subscribe
- Mute
- Subscribe to RSS Feed
- Permalink
- Report Inappropriate Content
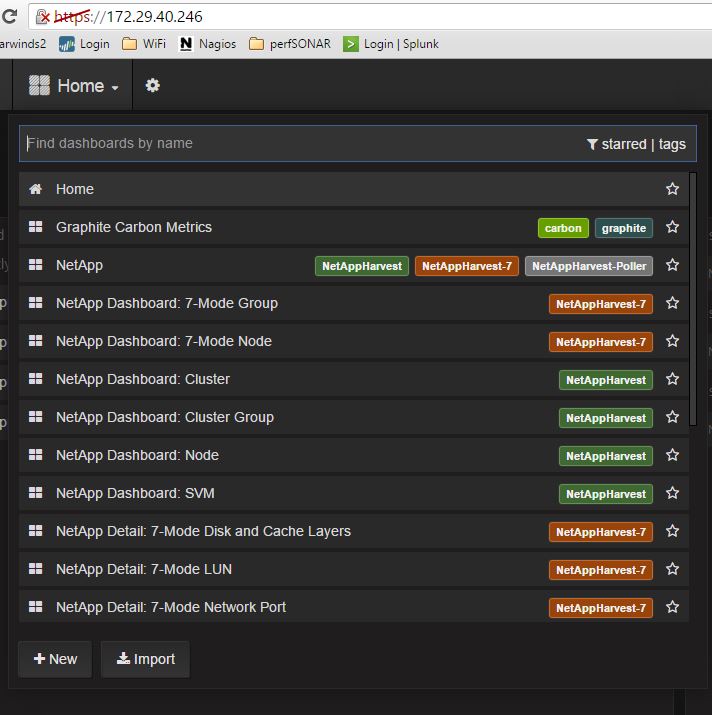
I now have imported dashboards. However, they are not populated with anything.
root@Netappharvest1:/home/ddurand# /opt/netapp-harvest/netapp-manager -import
[OK ] Will import dashboards to https://172.29.40.246
[OK ] Imported dashboard [db_netapp-dashboard-7-mode-group.json] successfully
[OK ] Imported dashboard [db_netapp-detail-disk-and-cache-layers.json] successfully
[OK ] Imported dashboard [db_netapp.json] successfully
[OK ] Imported dashboard [db_netapp-detail-7-mode-disk-and-cache-layers.json] successfully
[OK ] Imported dashboard [db_netapp-detail-7-mode-network-port.json] successfully
[OK ] Imported dashboard [db_netapp-detail-volume.json] successfully
[OK ] Imported dashboard [db_netapp-dashboard-cluster.json] successfully
[OK ] Imported dashboard [db_netapp-detail-7-mode-windows-file-services.json] successfully
[OK ] Imported dashboard [db_netapp-detail-graphite-server.json] successfully
[OK ] Imported dashboard [db_netapp-dashboard-svm.json] successfully
[OK ] Imported dashboard [db_netapp-dashboard-node.json] successfully
[OK ] Imported dashboard [db_netapp-dashboard-cluster-group.json] successfully
[OK ] Imported dashboard [db_netapp-detail-harvest-poller.json] successfully
[OK ] Imported dashboard [db_netapp-detail-network-lif.json] successfully
[OK ] Imported dashboard [db_netapp-detail-7-mode-volume.json] successfully
[OK ] Imported dashboard [db_netapp-detail-7-mode-lun.json] successfully
[OK ] Imported dashboard [db_netapp-detail-lun.json] successfully
[OK ] Imported dashboard [db_netapp-detail-network-port.json] successfully
[OK ] Imported dashboard [db_netapp-dashboard-7-mode-node.json] successfully
root@Netappharvest1:/home/ddurand#
- Mark as New
- Bookmark
- Subscribe
- Mute
- Subscribe to RSS Feed
- Permalink
- Report Inappropriate Content
But I am seeing this.
root@Netappharvest1:/home/ddurand# /opt/netapp-harvest/netapp-manager -stop
STATUS POLLER SITE
############### #################### ##################
[STOPPED] cluster_mgmt OR
root@Netappharvest1:/home/ddurand# /opt/netapp-harvest/netapp-manager -start
STATUS POLLER SITE
############### #################### ##################
[STARTED] cluster_mgmt OR
root@Netappharvest1:/home/ddurand# /opt/netapp-harvest/netapp-worker -poller cluster_mgmt -v
[2016-06-14 12:16:18] [NORMAL ] WORKER STARTED [Version: 1.2.2] [Conf: netapp-harvest.conf] [Poller: cluster_mgmt]
[2016-06-14 12:16:18] [WARNING] Started in foreground mode; messages to STDERR are redirected to the logfile and are not visible on the console.
[2016-06-14 12:16:18] [DEBUG ] [conf] Line [19] is Section [global]
[2016-06-14 12:16:18] [DEBUG ] [conf] Line [20] in Section [global] has Key/Value pair [grafana_api_key]=[eyJrIjoiNURNMGVOdU1Iem00dXlZSDRjd2dOQXVQVlVuZXRWUFQiLCJuIjoiR3JhcGhpdGUiLCJpZCI6MX0=]
[2016-06-14 12:16:18] [DEBUG ] [conf] Line [21] in Section [global] has Key/Value pair [grafana_url]=[https://172.29.40.246]
[2016-06-14 12:16:18] [DEBUG ] [conf] Line [22] in Section [global] has Key/Value pair [grafana_dl_tag]=[]
[2016-06-14 12:16:18] [DEBUG ] [conf] Line [28] is Section [default]
[2016-06-14 12:16:18] [DEBUG ] [conf] Line [30] in Section [default] has Key/Value pair [graphite_enabled]=[1]
[2016-06-14 12:16:18] [DEBUG ] [conf] Line [31] in Section [default] has Key/Value pair [graphite_server]=[172.29.40.246]
[2016-06-14 12:16:18] [DEBUG ] [conf] Line [32] in Section [default] has Key/Value pair [graphite_port]=[2003]
[2016-06-14 12:16:18] [DEBUG ] [conf] Line [33] in Section [default] has Key/Value pair [graphite_proto]=[tcp]
[2016-06-14 12:16:18] [DEBUG ] [conf] Line [34] in Section [default] has Key/Value pair [normalized_xfer]=[mb_per_sec]
[2016-06-14 12:16:18] [DEBUG ] [conf] Line [35] in Section [default] has Key/Value pair [normalized_time]=[millisec]
[2016-06-14 12:16:18] [DEBUG ] [conf] Line [36] in Section [default] has Key/Value pair [graphite_root]=[default]
[2016-06-14 12:16:18] [DEBUG ] [conf] Line [37] in Section [default] has Key/Value pair [graphite_meta_metrics_root]=[default]
[2016-06-14 12:16:18] [DEBUG ] [conf] Line [40] in Section [default] has Key/Value pair [host_type]=[OCUM]
[2016-06-14 12:16:18] [DEBUG ] [conf] Line [41] in Section [default] has Key/Value pair [host_port]=[443]
[2016-06-14 12:16:18] [DEBUG ] [conf] Line [42] in Section [default] has Key/Value pair [host_enabled]=[1]
[2016-06-14 12:16:18] [DEBUG ] [conf] Line [43] in Section [default] has Key/Value pair [template]=[default]
[2016-06-14 12:16:18] [DEBUG ] [conf] Line [44] in Section [default] has Key/Value pair [data_update_freq]=[60]
[2016-06-14 12:16:18] [DEBUG ] [conf] Line [45] in Section [default] has Key/Value pair [ntap_autosupport]=[0]
[2016-06-14 12:16:18] [DEBUG ] [conf] Line [46] in Section [default] has Key/Value pair [latency_io_reqd]=[10]
[2016-06-14 12:16:18] [DEBUG ] [conf] Line [47] in Section [default] has Key/Value pair [auth_type]=[password]
[2016-06-14 12:16:18] [DEBUG ] [conf] Line [48] in Section [default] has Key/Value pair [username]=[admin]
[2016-06-14 12:16:18] [DEBUG ] [conf] Line [49] in Section [default] has Key/Value pair [password]=[**********]
[2016-06-14 12:16:18] [DEBUG ] [conf] Line [60] is Section [cluster_mgmt]
[2016-06-14 12:16:18] [DEBUG ] [conf] Line [61] in Section [cluster_mgmt] has Key/Value pair [hostname]=[192.168.110.50]
[2016-06-14 12:16:18] [DEBUG ] [conf] Line [62] in Section [cluster_mgmt] has Key/Value pair [site]=[OR]
[2016-06-14 12:16:18] [DEBUG ] [conf] Line [67] in Section [cluster_mgmt] has Key/Value pair [hostname]=[172.29.40.60]
[2016-06-14 12:16:18] [DEBUG ] [conf] Line [68] in Section [cluster_mgmt] has Key/Value pair [site]=[OR]
[2016-06-14 12:16:18] [DEBUG ] [conf] Line [69] in Section [cluster_mgmt] has Key/Value pair [host_type]=[OCUM]
[2016-06-14 12:16:18] [DEBUG ] [conf] Line [70] in Section [cluster_mgmt] has Key/Value pair [data_update_freq]=[900]
[2016-06-14 12:16:18] [DEBUG ] [conf] Line [71] in Section [cluster_mgmt] has Key/Value pair [normalized:_xfer]=[gb_per_sec]
[2016-06-14 12:16:18] [NORMAL ] [main] Poller will monitor a [OCUM] at [172.29.40.60:443]
[2016-06-14 12:16:18] [NORMAL ] [main] Poller will use [password] authentication with username [admin] and password [**********]
[2016-06-14 12:16:18] [DEBUG ] [connect] Reverse hostname lookup successful. Using HTTP/1.1 for communication.
[2016-06-14 12:16:18] [DEBUG ] [sysinfo] Updating system-info cache
[2016-06-14 12:16:18] [WARNING] [sysinfo] system-about API failed with reason: Authorization failed
[2016-06-14 12:16:18] [WARNING] [main] system-info update failed; will try again in 10 seconds.
[2016-06-14 12:16:28] [DEBUG ] [sysinfo] Updating system-info cache
[2016-06-14 12:16:28] [WARNING] [sysinfo] system-about API failed with reason: Authorization failed
[2016-06-14 12:16:28] [WARNING] [main] system-info update failed; will try again in 10 seconds.
[2016-06-14 12:16:38] [DEBUG ] [sysinfo] Updating system-info cache
[2016-06-14 12:16:39] [WARNING] [sysinfo] system-about API failed with reason: Authorization failed
[2016-06-14 12:16:39] [WARNING] [main] system-info update failed; will try again in 10 seconds.
- Mark as New
- Bookmark
- Subscribe
- Mute
- Subscribe to RSS Feed
- Permalink
- Report Inappropriate Content
I tried a different password. Now I get this.
root@Netappharvest1:/home/ddurand# /opt/netapp-harvest/netapp-worker -poller cluster_mgmt -v
[2016-06-14 12:33:39] [NORMAL ] WORKER STARTED [Version: 1.2.2] [Conf: netapp-harvest.conf] [Poller: cluster_mgmt]
[2016-06-14 12:33:39] [WARNING] Started in foreground mode; messages to STDERR are redirected to the logfile and are not visible on the console.
[2016-06-14 12:33:39] [DEBUG ] [conf] Line [19] is Section [global]
[2016-06-14 12:33:39] [DEBUG ] [conf] Line [20] in Section [global] has Key/Value pair [grafana_api_key]=[eyJrIjoiNURNMGVOdU1Iem00dXlZSDRjd2dOQXVQVlVuZXRWUFQiLCJuIjoiR3JhcGhpdGUiLCJpZCI6MX0=]
[2016-06-14 12:33:39] [DEBUG ] [conf] Line [21] in Section [global] has Key/Value pair [grafana_url]=[https://172.29.40.246]
[2016-06-14 12:33:39] [DEBUG ] [conf] Line [22] in Section [global] has Key/Value pair [grafana_dl_tag]=[]
[2016-06-14 12:33:39] [DEBUG ] [conf] Line [28] is Section [default]
[2016-06-14 12:33:39] [DEBUG ] [conf] Line [30] in Section [default] has Key/Value pair [graphite_enabled]=[1]
[2016-06-14 12:33:39] [DEBUG ] [conf] Line [31] in Section [default] has Key/Value pair [graphite_server]=[172.29.40.246]
[2016-06-14 12:33:39] [DEBUG ] [conf] Line [32] in Section [default] has Key/Value pair [graphite_port]=[2003]
[2016-06-14 12:33:39] [DEBUG ] [conf] Line [33] in Section [default] has Key/Value pair [graphite_proto]=[tcp]
[2016-06-14 12:33:39] [DEBUG ] [conf] Line [34] in Section [default] has Key/Value pair [normalized_xfer]=[mb
[2016-06-14 12:33:39] [DEBUG ] [conf] Line [35] in Section [default] has Key/Value pair [normalized_time]=[mi
[2016-06-14 12:33:39] [DEBUG ] [conf] Line [36] in Section [default] has Key/Value pair [graphite_root]=[defa
[2016-06-14 12:33:39] [DEBUG ] [conf] Line [37] in Section [default] has Key/Value pair [graphite_meta_metric
[2016-06-14 12:33:39] [DEBUG ] [conf] Line [40] in Section [default] has Key/Value pair [host_type]=[OCUM]
[2016-06-14 12:33:39] [DEBUG ] [conf] Line [41] in Section [default] has Key/Value pair [host_port]=[443]
[2016-06-14 12:33:39] [DEBUG ] [conf] Line [42] in Section [default] has Key/Value pair [host_enabled]=[1]
[2016-06-14 12:33:39] [DEBUG ] [conf] Line [43] in Section [default] has Key/Value pair [template]=[default]
[2016-06-14 12:33:39] [DEBUG ] [conf] Line [44] in Section [default] has Key/Value pair [data_update_freq]=[6
[2016-06-14 12:33:39] [DEBUG ] [conf] Line [45] in Section [default] has Key/Value pair [ntap_autosupport]=[0
[2016-06-14 12:33:39] [DEBUG ] [conf] Line [46] in Section [default] has Key/Value pair [latency_io_reqd]=[10
[2016-06-14 12:33:39] [DEBUG ] [conf] Line [47] in Section [default] has Key/Value pair [auth_type]=[password
[2016-06-14 12:33:39] [DEBUG ] [conf] Line [48] in Section [default] has Key/Value pair [username]=[opmadmin]
[2016-06-14 12:33:39] [DEBUG ] [conf] Line [49] in Section [default] has Key/Value pair [password]=[*********
[2016-06-14 12:33:39] [DEBUG ] [conf] Line [60] is Section [cluster_mgmt]
[2016-06-14 12:33:39] [DEBUG ] [conf] Line [61] in Section [cluster_mgmt] has Key/Value pair [hostname]=[192.
[2016-06-14 12:33:39] [DEBUG ] [conf] Line [62] in Section [cluster_mgmt] has Key/Value pair [site]=[OR]
[2016-06-14 12:33:39] [DEBUG ] [conf] Line [67] in Section [cluster_mgmt] has Key/Value pair [hostname]=[172.
[2016-06-14 12:33:39] [DEBUG ] [conf] Line [68] in Section [cluster_mgmt] has Key/Value pair [site]=[OR]
[2016-06-14 12:33:39] [DEBUG ] [conf] Line [69] in Section [cluster_mgmt] has Key/Value pair [host_type]=[OCU
[2016-06-14 12:33:39] [DEBUG ] [conf] Line [70] in Section [cluster_mgmt] has Key/Value pair [data_update_fre
[2016-06-14 12:33:39] [DEBUG ] [conf] Line [71] in Section [cluster_mgmt] has Key/Value pair [normalized:_xfe
[2016-06-14 12:33:39] [NORMAL ] [main] Poller will monitor a [OCUM] at [172.29.40.60:443]
[2016-06-14 12:33:39] [NORMAL ] [main] Poller will use [password] authentication with username [opmadmin] and
[2016-06-14 12:33:39] [DEBUG ] [connect] Reverse hostname lookup successful. Using HTTP/1.1 for communicatio
[2016-06-14 12:33:39] [DEBUG ] [sysinfo] Updating system-info cache
[2016-06-14 12:33:39] [WARNING] [sysinfo] cluster-iter failed with reason: Unable to find API: cluster-iter
- Mark as New
- Bookmark
- Subscribe
- Mute
- Subscribe to RSS Feed
- Permalink
- Report Inappropriate Content
Harvest can collect performance data from Clustered & 7-Mode Data ONTAP (FILER), and from OnCommand Unified Manager (OCUM). The host_type variable sets if you have a FILER or OCUM. From the log you are trying to collect data with host_type = OCUM. Maybe try FILER?
More is documented in the Harvest admin guide.
Regards
Chris
- Mark as New
- Bookmark
- Subscribe
- Mute
- Subscribe to RSS Feed
- Permalink
- Report Inappropriate Content
Tried changing it, still no data population.
[2016-06-15 07:51:22] [NORMAL ] WORKER STARTED [Version: 1.2.2] [Conf: netapp-harvest.conf] [Poller: cluster_mgmt]
[2016-06-15 07:51:22] [WARNING] Started in foreground mode; messages to STDERR are redirected to the logfile and are not visible on the console.
[2016-06-15 07:51:22] [DEBUG ] [conf] Line [19] is Section [global]
[2016-06-15 07:51:22] [DEBUG ] [conf] Line [20] in Section [global] has Key/Value pair [grafana_api_key]=[eyJrIjoiNURNMGVOdU1Iem00dXlZSDRjd2dOQXVQVlVuZXRWUFQiLCJuIjoiR3JhcGhpdGUiLCJpZCI6MX0=]
[2016-06-15 07:51:22] [DEBUG ] [conf] Line [21] in Section [global] has Key/Value pair [grafana_url]=[https://172.29.40.246]
[2016-06-15 07:51:22] [DEBUG ] [conf] Line [22] in Section [global] has Key/Value pair [grafana_dl_tag]=[]
[2016-06-15 07:51:22] [DEBUG ] [conf] Line [28] is Section [default]
[2016-06-15 07:51:22] [DEBUG ] [conf] Line [30] in Section [default] has Key/Value pair [graphite_enabled]=[1]
[2016-06-15 07:51:22] [DEBUG ] [conf] Line [31] in Section [default] has Key/Value pair [graphite_server]=[172.29.40.246]
[2016-06-15 07:51:22] [DEBUG ] [conf] Line [32] in Section [default] has Key/Value pair [graphite_port]=[2003]
[2016-06-15 07:51:22] [DEBUG ] [conf] Line [33] in Section [default] has Key/Value pair [graphite_proto]=[tcp]
[2016-06-15 07:51:22] [DEBUG ] [conf] Line [34] in Section [default] has Key/Value pair [normalized_xfer]=[mb_per_sec]
[2016-06-15 07:51:22] [DEBUG ] [conf] Line [35] in Section [default] has Key/Value pair [normalized_time]=[millisec]
[2016-06-15 07:51:22] [DEBUG ] [conf] Line [36] in Section [default] has Key/Value pair [graphite_root]=[default]
[2016-06-15 07:51:22] [DEBUG ] [conf] Line [37] in Section [default] has Key/Value pair [graphite_meta_metrics_root]=[default]
[2016-06-15 07:51:22] [DEBUG ] [conf] Line [40] in Section [default] has Key/Value pair [host_type]=[OCUM]
[2016-06-15 07:51:22] [DEBUG ] [conf] Line [41] in Section [default] has Key/Value pair [host_port]=[443]
[2016-06-15 07:51:22] [DEBUG ] [conf] Line [42] in Section [default] has Key/Value pair [host_enabled]=[1]
[2016-06-15 07:51:22] [DEBUG ] [conf] Line [43] in Section [default] has Key/Value pair [template]=[default]
[2016-06-15 07:51:22] [DEBUG ] [conf] Line [44] in Section [default] has Key/Value pair [data_update_freq]=[60]
[2016-06-15 07:51:22] [DEBUG ] [conf] Line [45] in Section [default] has Key/Value pair [ntap_autosupport]=[0]
[2016-06-15 07:51:22] [DEBUG ] [conf] Line [46] in Section [default] has Key/Value pair [latency_io_reqd]=[10]
[2016-06-15 07:51:22] [DEBUG ] [conf] Line [47] in Section [default] has Key/Value pair [auth_type]=[password]
[2016-06-15 07:51:22] [DEBUG ] [conf] Line [48] in Section [default] has Key/Value pair [username]=[opmadmin]
[2016-06-15 07:51:22] [DEBUG ] [conf] Line [49] in Section [default] has Key/Value pair [password]=[**********]
[2016-06-15 07:51:22] [DEBUG ] [conf] Line [60] is Section [cluster_mgmt]
[2016-06-15 07:51:22] [DEBUG ] [conf] Line [61] in Section [cluster_mgmt] has Key/Value pair [hostname]=[192.168.110.50]
[2016-06-15 07:51:22] [DEBUG ] [conf] Line [62] in Section [cluster_mgmt] has Key/Value pair [site]=[OR]
[2016-06-15 07:51:22] [DEBUG ] [conf] Line [67] in Section [cluster_mgmt] has Key/Value pair [hostname]=[172.29.40.60]
[2016-06-15 07:51:22] [DEBUG ] [conf] Line [68] in Section [cluster_mgmt] has Key/Value pair [site]=[OR]
[2016-06-15 07:51:22] [DEBUG ] [conf] Line [69] in Section [cluster_mgmt] has Key/Value pair [host_type]=[FILER]
[2016-06-15 07:51:22] [DEBUG ] [conf] Line [70] in Section [cluster_mgmt] has Key/Value pair [data_update_freq]=[900]
[2016-06-15 07:51:22] [DEBUG ] [conf] Line [71] in Section [cluster_mgmt] has Key/Value pair [normalized:_xfer]=[gb_per_sec]
[2016-06-15 07:51:22] [NORMAL ] [main] Poller will monitor a [FILER] at [172.29.40.60:443]
[2016-06-15 07:51:22] [NORMAL ] [main] Poller will use [password] authentication with username [opmadmin] and password [**********]
[2016-06-15 07:51:22] [DEBUG ] [connect] Reverse hostname lookup successful. Using HTTP/1.1 for communication.
[2016-06-15 07:51:22] [DEBUG ] [sysinfo] Updating system-info cache
[2016-06-15 07:51:22] [WARNING] [sysinfo] Update of system-info cache DOT Version failed with reason: Authorization failed
[2016-06-15 07:51:22] [WARNING] [main] system-info update failed; will try again in 10 seconds.
##
## Configuration file for NetApp Harvest
##
## Create a section header and then populate with key/value parameters
## for each system to monitor. Lines can be commented out by preceding them
## with a hash symbol ('#'). Values in all capitals should be replaced with
## your values, all other values can be left as-is to use defaults
##
## There are two reserved section names:
## [global] - Global key/value pairs for installation
## [default] - Any key/value pairs specified here will be the default
## value for a poller should it not be listed in a poller section.
##
##
## Global reserved section
##
[global]
grafana_api_key = eyJrIjoiNURNMGVOdU1Iem00dXlZSDRjd2dOQXVQVlVuZXRWUFQiLCJuIjoiR3JhcGhpdGUiLCJpZCI6MX0=
grafana_url = https://172.29.40.246
grafana_dl_tag =
##
## Default reserved section
##
[default]
#====== Graphite server setup defaults ========================================
graphite_enabled = 1
graphite_server = 172.29.40.246
graphite_port = 2003
graphite_proto = tcp
normalized_xfer = mb_per_sec
normalized_time = millisec
graphite_root = default
graphite_meta_metrics_root = default
#====== Polled host setup defaults ============================================
host_type = OCUM
host_port = 443
host_enabled = 1
template = default
data_update_freq = 60
ntap_autosupport = 0
latency_io_reqd = 10
auth_type = password
username = opmadmin
password = *****
#ssl_cert = INSERT_PEM_FILE_NAME_HERE
#ssl_key = INSERT_KEY_FILE_NAME_HERE
##
## Monitored host examples - Use one section like the below for each monitored host
##
#====== 7DOT (node) or cDOT (cluster LIF) for performance info ================
#
[cluster_mgmt]
hostname = 192.168.110.50
site = OR
#====== OnCommand Unified Manager (OCUM) for cDOT capacity info ===============
#
#[scornopm1]
hostname = 172.29.40.60
site = OR
host_type = FILER
data_update_freq = 900
normalized:_xfer = gb_per_sec
- Mark as New
- Bookmark
- Subscribe
- Mute
- Subscribe to RSS Feed
- Permalink
- Report Inappropriate Content
- Mark as New
- Bookmark
- Subscribe
- Mute
- Subscribe to RSS Feed
- Permalink
- Report Inappropriate Content
Hi,
Your netapp-harvest.conf file has a few inconsistencies, and if Harvest doesn't collect then nothing will show in Graphite/Grafana.
First, start with this as your netapp-harvest.conf file:
##
## Configuration file for NetApp Harvest
##
## Create a section header and then populate with key/value parameters
## for each system to monitor.  Lines can be commented out by preceding them
## with a hash symbol ('#').  Values in all capitals should be replaced with
## your values, all other values can be left as-is to use defaults
##
## There are two reserved section names:
## [global]  - Global key/value pairs for installation
## [default] - Any key/value pairs specified here will be the default
##             value for a poller should it not be listed in a poller section.
##

##
## Global reserved section
##

[global]
grafana_api_key = eyJrIjoiNURNMGVOdU1Iem00dXlZSDRjd2dOQXVQVlVuZXRWUFQiLCJuIjoiR3JhcGhpdGUiLCJpZCI6MX0=
grafana_url = https://172.29.40.246
grafana_dl_tag =

##
## Default reserved section
##

[default]
#====== Graphite server setup defaults ========================================
graphite_enabled  = 1
graphite_server   = 172.29.40.246
graphite_port     = 2003
graphite_proto    = tcp
normalized_xfer   = mb_per_sec
normalized_time   = millisec
graphite_root     =  default
graphite_meta_metrics_root  = default

#====== Polled host setup defaults ============================================
host_type         = FILER
host_port         = 443
host_enabled      = 1
template          = default
data_update_freq  = 60
ntap_autosupport  = 0
latency_io_reqd   = 10
auth_type         = password
username          = opmadmin
password          = INSERT_PASSWORD_HERE
ssl_cert          = INSERT_PEM_FILE_NAME_HERE
ssl_key           = INSERT_KEY_FILE_NAME_HERE


##
## Monitored host examples - Use one section like the below for each monitored host
##

#====== 7DOT (node) or cDOT (cluster LIF) for performance info ================
#
[INSERT_CLUSTER_OR_CONTROLLER_NAME_HERE]
hostname       = 192.168.110.50
site           = OR

#====== OnCommand Unified Manager (OCUM) for cDOT capacity info ===============
#
[scornopm1]
hostname          = 172.29.40.60
site              = OR
host_type         = OCUM
data_update_freq  = 900
normalized_xfer   = gb_per_sec
Next:
1) Replace INSERT_PASSWORD_HERE with your password
2) Replace INSERT_CLUSTER_OR_CONTROLLER_NAME_HERE with the name of your cluster (not the cluster lif, but the cluster name shown from 'cluster identity show')
Then, on both your cDOT cluster and your OCUM server (Unified Manager server, not Performance Manager server) you must have the opmadmin account created and password set. These accounts must have minimim privileges as defined in the Harvest user guide. Because your OCUM servername has opm in it I am wondering if you also need to update the details to be for your OCUM server (and not OPM server). If this is a misunderstanding, update the hostname and IP address to be your OCUM server.
Lastly start the pollers with
/opt/netapp-harvest/netapp-manager -start
Hope this helps.
Cheers,
Chris Madden
Storage Architect, NetApp EMEA (and author of Harvest)
Blog: It all begins with data
If this post resolved your issue, please help others by selecting ACCEPT AS SOLUTION or adding a KUDO or both!
- Mark as New
- Bookmark
- Subscribe
- Mute
- Subscribe to RSS Feed
- Permalink
- Report Inappropriate Content
Some different indications with the new settings. Can't find that new DNS name?
root@Netappharvest1:~# /opt/netapp-harvest/netapp-worker -poller SCORSAN -v
[2016-06-15 10:28:50] [NORMAL ] WORKER STARTED [Version: 1.2.2] [Conf: netapp-harvest.conf] [Poller: SCORSAN]
[2016-06-15 10:28:50] [WARNING] Started in foreground mode; messages to STDERR are redirected to the logfile and are not visible on the console.
[2016-06-15 10:28:50] [DEBUG ] [conf] Line [19] is Section [global]
[2016-06-15 10:28:50] [DEBUG ] [conf] Line [20] in Section [global] has Key/Value pair [grafana_api_key]=[eyJrIjoiNURNMGVOdU1Iem00dXlZSDRjd2dOQXVQVlVuZXRWUFQiLCJuIjoiR3JhcGhpdGUiLCJpZCI6MX0=]
[2016-06-15 10:28:50] [DEBUG ] [conf] Line [21] in Section [global] has Key/Value pair [grafana_url]=[https://172.29.40.246]
[2016-06-15 10:28:50] [DEBUG ] [conf] Line [22] in Section [global] has Key/Value pair [grafana_dl_tag]=[]
[2016-06-15 10:28:50] [DEBUG ] [conf] Line [28] is Section [default]
[2016-06-15 10:28:50] [DEBUG ] [conf] Line [30] in Section [default] has Key/Value pair [graphite_enabled]=[1]
[2016-06-15 10:28:50] [DEBUG ] [conf] Line [31] in Section [default] has Key/Value pair [graphite_server]=[172.29.40.246]
[2016-06-15 10:28:50] [DEBUG ] [conf] Line [32] in Section [default] has Key/Value pair [graphite_port]=[2003]
[2016-06-15 10:28:50] [DEBUG ] [conf] Line [33] in Section [default] has Key/Value pair [graphite_proto]=[tcp]
[2016-06-15 10:28:50] [DEBUG ] [conf] Line [34] in Section [default] has Key/Value pair [normalized_xfer]=[mb_per_sec]
[2016-06-15 10:28:50] [DEBUG ] [conf] Line [35] in Section [default] has Key/Value pair [normalized_time]=[millisec]
[2016-06-15 10:28:50] [DEBUG ] [conf] Line [36] in Section [default] has Key/Value pair [graphite_root]=[default]
[2016-06-15 10:28:50] [DEBUG ] [conf] Line [37] in Section [default] has Key/Value pair [graphite_meta_metrics_root]=[default]
[2016-06-15 10:28:50] [DEBUG ] [conf] Line [40] in Section [default] has Key/Value pair [host_type]=[OCUM]
[2016-06-15 10:28:50] [DEBUG ] [conf] Line [41] in Section [default] has Key/Value pair [host_port]=[443]
[2016-06-15 10:28:50] [DEBUG ] [conf] Line [42] in Section [default] has Key/Value pair [host_enabled]=[1]
[2016-06-15 10:28:50] [DEBUG ] [conf] Line [43] in Section [default] has Key/Value pair [template]=[default]
[2016-06-15 10:28:50] [DEBUG ] [conf] Line [44] in Section [default] has Key/Value pair [data_update_freq]=[60]
[2016-06-15 10:28:50] [DEBUG ] [conf] Line [45] in Section [default] has Key/Value pair [ntap_autosupport]=[0]
[2016-06-15 10:28:50] [DEBUG ] [conf] Line [46] in Section [default] has Key/Value pair [latency_io_reqd]=[10]
[2016-06-15 10:28:50] [DEBUG ] [conf] Line [47] in Section [default] has Key/Value pair [auth_type]=[password]
[2016-06-15 10:28:50] [DEBUG ] [conf] Line [48] in Section [default] has Key/Value pair [username]=[opmadmin]
[2016-06-15 10:28:50] [DEBUG ] [conf] Line [49] in Section [default] has Key/Value pair [password]=[**********]
[2016-06-15 10:28:50] [DEBUG ] [conf] Line [50] in Section [default] has Key/Value pair [ssl_cert]=[INSERT_PEM_FILE_NAME_HERE]
[2016-06-15 10:28:50] [DEBUG ] [conf] Line [51] in Section [default] has Key/Value pair [ssl_key]=[INSERT_KEY_FILE_NAME_HERE]
[2016-06-15 10:28:50] [DEBUG ] [conf] Line [60] is Section [SCORSAN]
[2016-06-15 10:28:50] [DEBUG ] [conf] Line [61] in Section [SCORSAN] has Key/Value pair [hostname]=[192.168.110.50]
[2016-06-15 10:28:50] [DEBUG ] [conf] Line [62] in Section [SCORSAN] has Key/Value pair [site]=[OR]
[2016-06-15 10:28:50] [DEBUG ] [conf] Line [66] is Section [scornopm1]
[2016-06-15 10:28:50] [DEBUG ] [conf] Line [67] in Section [scornopm1] has Key/Value pair [hostname]=[172.29.40.60]
[2016-06-15 10:28:50] [DEBUG ] [conf] Line [68] in Section [scornopm1] has Key/Value pair [site]=[OR]
[2016-06-15 10:28:50] [DEBUG ] [conf] Line [69] in Section [scornopm1] has Key/Value pair [host_type]=[OCUM]
[2016-06-15 10:28:50] [DEBUG ] [conf] Line [70] in Section [scornopm1] has Key/Value pair [data_update_freq]=[900]
[2016-06-15 10:28:50] [DEBUG ] [conf] Line [71] in Section [scornopm1] has Key/Value pair [normalized:_xfer]=[gb_per_sec]
[2016-06-15 10:28:50] [NORMAL ] [main] Poller will monitor a [OCUM] at [192.168.110.50:443]
[2016-06-15 10:28:50] [NORMAL ] [main] Poller will use [password] authentication with username [opmadmin] and password [**********]
[2016-06-15 10:28:50] [WARNING] [connect] Setting HTTP/1.0 because reverse hostname resolution (IP -> hostname) fails. To enable HTTP/1.1 ensure reverse hostname resolution succeeds.
[2016-06-15 10:28:50] [DEBUG ] [sysinfo] Updating system-info cache
[2016-06-15 10:28:50] [WARNING] [sysinfo] system-about API failed with reason: Server returned HTTP Error: 404 Not
- Mark as New
- Bookmark
- Subscribe
- Mute
- Subscribe to RSS Feed
- Permalink
- Report Inappropriate Content
Your [default] section still has host_type = OCUM, not FILER like I posted in the example. So that means SCORSAN is connected to as a OCUM system.
- Mark as New
- Bookmark
- Subscribe
- Mute
- Subscribe to RSS Feed
- Permalink
- Report Inappropriate Content
I think I made the changes you wanted, see after verbose logging.
root@Netappharvest1:~# /opt/netapp-harvest/netapp-worker -poller SCORSAN -v
[2016-06-15 19:42:48] [NORMAL ] WORKER STARTED [Version: 1.2.2] [Conf: netapp-harvest.conf] [Poller: SCORSAN]
[2016-06-15 19:42:48] [WARNING] Started in foreground mode; messages to STDERR are redirected to the logfile and are not visible on the console.
[2016-06-15 19:42:48] [DEBUG ] [conf] Line [19] is Section [global]
[2016-06-15 19:42:48] [DEBUG ] [conf] Line [20] in Section [global] has Key/Value pair [grafana_api_key]=[eyJrIjoiNURNMGVOdU1Iem00dXlZSDRjd2dOQXVQVlVuZXRWUFQiLCJuIjoiR3JhcGhpdGUiLCJpZCI6MX0=]
[2016-06-15 19:42:48] [DEBUG ] [conf] Line [21] in Section [global] has Key/Value pair [grafana_url]=[https://172.29.40.246]
[2016-06-15 19:42:48] [DEBUG ] [conf] Line [22] in Section [global] has Key/Value pair [grafana_dl_tag]=[]
[2016-06-15 19:42:48] [DEBUG ] [conf] Line [28] is Section [default]
[2016-06-15 19:42:48] [DEBUG ] [conf] Line [30] in Section [default] has Key/Value pair [graphite_enabled]=[1]
[2016-06-15 19:42:48] [DEBUG ] [conf] Line [31] in Section [default] has Key/Value pair [graphite_server]=[172.29.40.246]
[2016-06-15 19:42:48] [DEBUG ] [conf] Line [32] in Section [default] has Key/Value pair [graphite_port]=[2003]
[2016-06-15 19:42:48] [DEBUG ] [conf] Line [33] in Section [default] has Key/Value pair [graphite_proto]=[tcp]
[2016-06-15 19:42:48] [DEBUG ] [conf] Line [34] in Section [default] has Key/Value pair [normalized_xfer]=[mb_per_sec]
[2016-06-15 19:42:48] [DEBUG ] [conf] Line [35] in Section [default] has Key/Value pair [normalized_time]=[millisec]
[2016-06-15 19:42:48] [DEBUG ] [conf] Line [36] in Section [default] has Key/Value pair [graphite_root]=[default]
[2016-06-15 19:42:48] [DEBUG ] [conf] Line [37] in Section [default] has Key/Value pair [graphite_meta_metrics_root]=[default]
[2016-06-15 19:42:48] [DEBUG ] [conf] Line [40] in Section [default] has Key/Value pair [host_type]=[FILER]
[2016-06-15 19:42:48] [DEBUG ] [conf] Line [41] in Section [default] has Key/Value pair [host_port]=[443]
[2016-06-15 19:42:48] [DEBUG ] [conf] Line [42] in Section [default] has Key/Value pair [host_enabled]=[1]
[2016-06-15 19:42:48] [DEBUG ] [conf] Line [43] in Section [default] has Key/Value pair [template]=[default]
[2016-06-15 19:42:48] [DEBUG ] [conf] Line [44] in Section [default] has Key/Value pair [data_update_freq]=[60]
[2016-06-15 19:42:48] [DEBUG ] [conf] Line [45] in Section [default] has Key/Value pair [ntap_autosupport]=[0]
[2016-06-15 19:42:48] [DEBUG ] [conf] Line [46] in Section [default] has Key/Value pair [latency_io_reqd]=[10]
[2016-06-15 19:42:48] [DEBUG ] [conf] Line [47] in Section [default] has Key/Value pair [auth_type]=[password]
[2016-06-15 19:42:48] [DEBUG ] [conf] Line [48] in Section [default] has Key/Value pair [username]=[opmadmin]
[2016-06-15 19:42:48] [DEBUG ] [conf] Line [49] in Section [default] has Key/Value pair [password]=[**********]
[2016-06-15 19:42:48] [DEBUG ] [conf] Line [50] in Section [default] has Key/Value pair [ssl_cert]=[INSERT_PEM_FILE_NAME_HERE]
[2016-06-15 19:42:48] [DEBUG ] [conf] Line [51] in Section [default] has Key/Value pair [ssl_key]=[INSERT_KEY_FILE_NAME_HERE]
[2016-06-15 19:42:48] [DEBUG ] [conf] Line [60] is Section [SCORSAN]
[2016-06-15 19:42:48] [DEBUG ] [conf] Line [61] in Section [SCORSAN] has Key/Value pair [hostname]=[192.168.110.50]
[2016-06-15 19:42:48] [DEBUG ] [conf] Line [62] in Section [SCORSAN] has Key/Value pair [site]=[OR]
[2016-06-15 19:42:48] [DEBUG ] [conf] Line [66] is Section [scornopm1]
[2016-06-15 19:42:48] [DEBUG ] [conf] Line [67] in Section [scornopm1] has Key/Value pair [hostname]=[172.29.40.60]
[2016-06-15 19:42:48] [DEBUG ] [conf] Line [68] in Section [scornopm1] has Key/Value pair [site]=[OR]
[2016-06-15 19:42:48] [DEBUG ] [conf] Line [69] in Section [scornopm1] has Key/Value pair [host_type]=[OCUM]
[2016-06-15 19:42:48] [DEBUG ] [conf] Line [70] in Section [scornopm1] has Key/Value pair [data_update_freq]=[900]
[2016-06-15 19:42:48] [DEBUG ] [conf] Line [71] in Section [scornopm1] has Key/Value pair [normalized:_xfer]=[gb_per_sec]
[2016-06-15 19:42:48] [NORMAL ] [main] Poller will monitor a [FILER] at [192.168.110.50:443]
[2016-06-15 19:42:48] [NORMAL ] [main] Poller will use [password] authentication with username [opmadmin] and password [**********]
[2016-06-15 19:42:48] [WARNING] [connect] Setting HTTP/1.0 because reverse hostname resolution (IP -> hostname) fails. To enable HTTP/1.1 ensure reverse hostname resolution succeeds.
[2016-06-15 19:42:48] [DEBUG ] [sysinfo] Updating system-info cache
[2016-06-15 19:42:50] [WARNING] [sysinfo] Update of system-info cache DOT Version failed with reason: Authorization failed
root@Netappharvest1:~# cat /opt/netapp-harvest/netapp-harvest.conf
##
## Configuration file for NetApp Harvest
##
## Create a section header and then populate with key/value parameters
## for each system to monitor. Lines can be commented out by preceding them
## with a hash symbol ('#'). Values in all capitals should be replaced with
## your values, all other values can be left as-is to use defaults
##
## There are two reserved section names:
## [global] - Global key/value pairs for installation
## [default] - Any key/value pairs specified here will be the default
## value for a poller should it not be listed in a poller section.
##
##
## Global reserved section
##
[global]
grafana_api_key = eyJrIjoiNURNMGVOdU1Iem00dXlZSDRjd2dOQXVQVlVuZXRWUFQiLCJuIjoiR3JhcGhpdGUiLCJpZCI6MX0=
grafana_url = https://172.29.40.246
grafana_dl_tag =
##
## Default reserved section
##
[default]
#====== Graphite server setup defaults ========================================
graphite_enabled = 1
graphite_server = 172.29.40.246
graphite_port = 2003
graphite_proto = tcp
normalized_xfer = mb_per_sec
normalized_time = millisec
graphite_root = default
graphite_meta_metrics_root = default
#====== Polled host setup defaults ============================================
host_type = FILER
host_port = 443
host_enabled = 1
template = default
data_update_freq = 60
ntap_autosupport = 0
latency_io_reqd = 10
auth_type = password
username = opmadmin
password = ****
ssl_cert = INSERT_PEM_FILE_NAME_HERE
ssl_key = INSERT_KEY_FILE_NAME_HERE
##
## Monitored host examples - Use one section like the below for each monitored host
##
#====== 7DOT (node) or cDOT (cluster LIF) for performance info ================
#
[SCORSAN]
hostname = 192.168.110.50
site = OR
#====== OnCommand Unified Manager (OCUM) for cDOT capacity info ===============
#
[scornopm1]
hostname = 172.29.40.60
site = OR
host_type = OCUM
data_update_freq = 900
normalized:_xfer = gb_per_sec
- Mark as New
- Bookmark
- Subscribe
- Mute
- Subscribe to RSS Feed
- Permalink
- Report Inappropriate Content
[2016-06-15 19:42:48] [NORMAL ] [main] Poller will monitor a [FILER] at [192.168.110.50:443]
[2016-06-15 19:42:48] [NORMAL ] [main] Poller will use [password] authentication with username [opmadmin] and password [**********]
[2016-06-15 19:42:48] [WARNING] [connect] Setting HTTP/1.0 because reverse hostname resolution (IP -> hostname) fails. To enable HTTP/1.1 ensure reverse hostname resolution succeeds.
[2016-06-15 19:42:48] [DEBUG ] [sysinfo] Updating system-info cache
[2016-06-15 19:42:50] [WARNING] [sysinfo] Update of system-info cache DOT Version failed with reason: Authorization failed
Check the IP address is the cluster lif.
Check the opmadmin account has been created on the cluster with the correct password and privileges.
You could also try the admin account temporarily to rule out an account issue.
Cheers,
Chris
- Mark as New
- Bookmark
- Subscribe
- Mute
- Subscribe to RSS Feed
- Permalink
- Report Inappropriate Content
Which would be?
SCORSAN::> network interface show
Logical Status Network Current Current Is
Vserver Interface Admin/Oper Address/Mask Node Port Home
----------- ---------- ---------- ------------------ ------------- ------- ----
Cluster
SCORSAN01_clus1
up/up 169.254.179.178/16 SCORSAN01 e0a true
SCORSAN01_clus2
up/up 169.254.191.27/16 SCORSAN01 e0c true
SCORSAN02_clus1
up/up 169.254.99.148/16 SCORSAN02 e0a true
SCORSAN02_clus2
up/up 169.254.96.93/16 SCORSAN02 e0c true
SCORSAN
SCORSAN01_node_mgmt
up/up 192.168.110.51/24 SCORSAN01 e0M true
SCORSAN02_node_mgmt
up/up 192.168.110.52/24 SCORSAN02 e0M true
cluster_mgmt up/up 192.168.110.50/24 SCORSAN01 e0M true
scorsan1_icl up/up 172.29.1.207/24 SCORSAN01 a10g-11 true
scorsan2_icl up/up 172.29.1.208/24 SCORSAN02 a10g-11 true
scorsvm01
cifs_01 up/up 172.29.1.201/24 SCORSAN01 a10g-11 true
cifs_02 up/up 172.29.1.202/24 SCORSAN02 a10g-11 true
iscsi_01 up/up 172.29.62.5/24 SCORSAN01 a10g-13 true
iscsi_02 up/up 172.29.62.6/24 SCORSAN02 a10g-13 true
mgmt_lif up/up 192.168.110.55/24 SCORSAN01 e0i true
nfs_10 up/up 172.29.61.10/24 SCORSAN02 a10g-12 true
nfs_11 up/up 172.29.61.11/24 SCORSAN01 a10g-12 true
nfs_12 up/up 172.29.61.12/24 SCORSAN02 a10g-12 true
nfs_13 up/up 172.29.61.13/24 SCORSAN01 a10g-12 true
nfs_14 up/up 172.29.61.14/24 SCORSAN02 a10g-12 true
nfs_15 up/up 172.29.61.15/24 SCORSAN01 a10g-12 true
nfs_16 up/up 172.29.61.16/24 SCORSAN02 a10g-12 true
nfs_17 up/up 172.29.61.17/24 SCORSAN01 a10g-12 true
nfs_18 up/up 172.29.61.18/24 SCORSAN02 a10g-12 true
nfs_19 up/up 172.29.61.19/24 SCORSAN01 a10g-12 true
nfs_20 up/up 172.29.61.20/24 SCORSAN02 a10g-12 true
nfs_5 up/up 172.29.61.5/24 SCORSAN01 a10g-12 true
nfs_6 up/up 172.29.61.6/24 SCORSAN01 a10g-12 true
nfs_7 up/up 172.29.61.7/24 SCORSAN01 a10g-12 true
nfs_8 up/up 172.29.61.8/24 SCORSAN01 a10g-12 true
nfs_9 up/up 172.29.61.9/24 SCORSAN02 a10g-12 true
30 entries were displayed.
- Mark as New
- Bookmark
- Subscribe
- Mute
- Subscribe to RSS Feed
- Permalink
- Report Inappropriate Content
The list of cluster_mgt lifs can be shown using:
blob1::> net int show -role cluster-mgmt
  (network interface show)
            Logical    Status     Network            Current       Current Is
Vserver     Interface  Admin/Oper Address/Mask       Node          Port    Home
----------- ---------- ---------- ------------------ ------------- ------- ----
blob1
            cluster_mgmt up/up    10.64.32.220/24    mt_stc4009    e0a     true
From the names of your LIFs it looks like you are talking to a cluster lif. So then the Authorization failed message is telling you that the account is still incorrect.
I would just create a new user as stated in the Harvest admin guide:
security login role create -role netapp-harvest-role -access readonly -cmddirname "version"
security login role create -role netapp-harvest-role -access readonly -cmddirname "cluster identity show"
security login role create -role netapp-harvest-role -access readonly -cmddirname "cluster show"
security login role create -role netapp-harvest-role -access readonly -cmddirname "system node show"
security login role create -role netapp-harvest-role -access readonly -cmddirname "statistics"
security login role create -role netapp-harvest-role -access readonly -cmddirname "lun show"
security login role create -role netapp-harvest-role -access readonly -cmddirname "network interface show"
security login role create -role netapp-harvest-role -access readonly -cmddirname "qos workload show"


security login create -user-or-group-name netapp-harvest -application ontapi -role netapp-harvest-role -authmethod password
Then update your netapp-harvest.conf file poller section to this:
[SCORSAN]
hostname       = 192.168.110.50
username       = netapp-harvest
password       = YOUR_PASSWORD
site           = OR
And restart the poller:
/opt/netapp-harvest/netapp-manager -restart
Cheers,
Chris
- Mark as New
- Bookmark
- Subscribe
- Mute
- Subscribe to RSS Feed
- Permalink
- Report Inappropriate Content
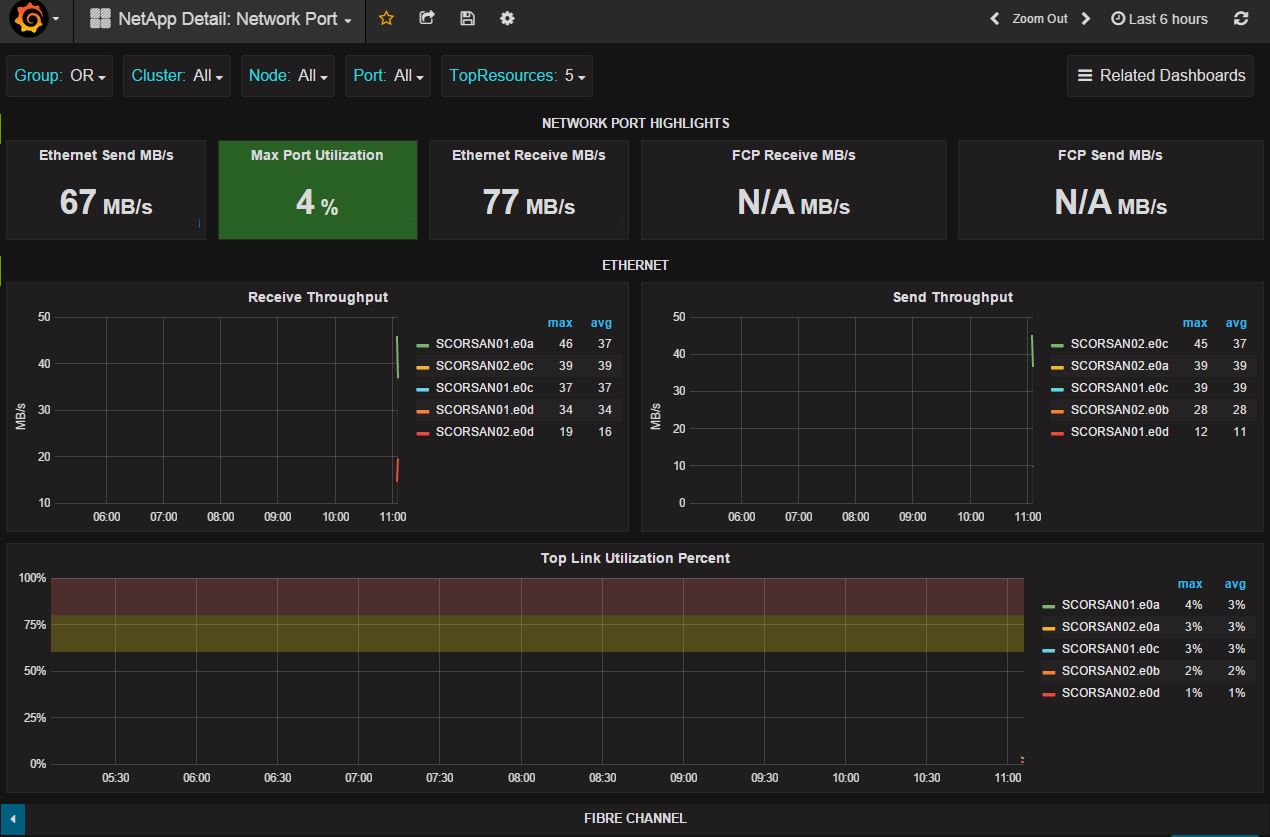
This is just some of the output, but it looks like it's working after I added the account to the Netapp. I attached a screenshot also.
I'm a network engineer that shouldn't even be working on this, but take a look at the screenshot and see if you think it's working correctly.
Thanks for all your help.
[vdi_02-wid1352.DELAY_CENTER_NETWORK] [wait_time] = [0]
[2016-06-16 11:02:06] [DEBUG ] [workload_detail_volume][SCORSAN02:kernel:vdi_02-wid1352.DELAY_CENTER_NETWORK][vdi_02-wid1352.DELAY_CENTER_NETWORK] [service_time] = [0]
[2016-06-16 11:02:06] [DEBUG ] [workload_detail_volume][SCORSAN02:kernel:vdi_02-wid1352.DELAY_CENTER_NETWORK][vdi_02-wid1352.DELAY_CENTER_NETWORK] [wait_time] = [0]
[2016-06-16 11:02:06] [DEBUG ] [workload_detail_volume][SCORSAN01:kernel:vdi_02-wid1352.DELAY_CENTER_QOS_LIMIT][vdi_02-wid1352.DELAY_CENTER_QOS_LIMIT] [service_time] = [0]
[2016-06-16 11:02:06] [DEBUG ] [workload_detail_volume][SCORSAN01:kernel:vdi_02-wid1352.DELAY_CENTER_QOS_LIMIT][vdi_02-wid1352.DELAY_CENTER_QOS_LIMIT] [wait_time] = [0]
[2016-06-16 11:02:06] [DEBUG ] [workload_detail_volume][SCORSAN02:kernel:vdi_02-wid1352.DELAY_CENTER_QOS_LIMIT][vdi_02-wid1352.DELAY_CENTER_QOS_LIMIT] [service_time] = [0]
[2016-06-16 11:02:06] [DEBUG ] [workload_detail_volume][SCORSAN02:kernel:vdi_02-wid1352.DELAY_CENTER_QOS_LIMIT][vdi_02-wid1352.DELAY_CENTER_QOS_LIMIT] [wait_time] = [0]
[2016-06-16 11:02:06] [DEBUG ] [workload_detail_volume][SCORSAN01:kernel:vdi_sas-wid13212.CPU_dblade][vdi_sas-wid13212.CPU_dblade] [service_time] = [1268560475543]
[2016-06-16 11:02:06] [DEBUG ] [workload_detail_volume][SCORSAN01:kernel:vdi_sas-wid13212.CPU_dblade][vdi_sas-wid13212.CPU_dblade] [wait_time] = [3984048371222]
[2016-06-16 11:02:06] [DEBUG ] [workload_detail_volume][SCORSAN02:kernel:vdi_sas-wid13212.CPU_dblade][vdi_sas-wid13212.CPU_dblade] [service_time] = [0]
[2016-06-16 11:02:06] [DEBUG ] [workload_detail_volume][SCORSAN02:kernel:vdi_sas-wid13212.CPU_dblade][vdi_sas-wid13212.CPU_dblade] [wait_time] = [0]
[2016-06-16 11:02:06] [DEBUG ] [workload_detail_volume][SCORSAN01:kernel:vdi_sas-wid13212.CPU_nblade][vdi_sas-wid13212.CPU_nblade] [service_time] = [857995623192]
[2016-06-16 11:02:06] [DEBUG ] [workload_detail_volume][SCORSAN01:kernel:vdi_sas-wid13212.CPU_nblade][vdi_sas-wid13212.CPU_nblade] [wait_time] = [1275958009261]
[2016-06-16 11:02:06] [DEBUG ] [workload_detail_volume][SCORSAN02:kernel:vdi_sas-wid13212.CPU_nblade][vdi_sas-wid13212.CPU_nblade] [service_time] = [0]
[2016-06-16 11:02:06] [DEBUG ] [workload_detail_volume][SCORSAN02:kernel:vdi_sas-wid13212.CPU_nblade][vdi_sas-wid13212.CPU_nblade] [wait_time] = [0]
[2016-06-16 11:02:06] [DEBUG ] [workload_detail_volume][SCORSAN01:kernel:vdi_sas-wid13212.DELAY_CENTER_CLUSTER_INTERCONNECT][vdi_sas-wid13212.DELAY_CENTER_CLUSTER_INTERCONNECT] [service_time] = [0]
[2016-06-16 11:02:06] [DEBUG ] [workload_detail_volume][SCORSAN01:kernel:vdi_sas-wid13212.DELAY_CENTER_CLUSTER_INTERCONNECT][vdi_sas-wid13212.DELAY_CENTER_CLUSTER_INTERCONNECT] [wait_time] = [0]
[2016-06-16 11:02:06] [DEBUG ] [workload_detail_volume][SCORSAN02:kernel:vdi_sas-wid13212.DELAY_CENTER_CLUSTER_INTERCONNECT][vdi_sas-wid13212.DELAY_CENTER_CLUSTER_INTERCONNECT] [service_time] = [0]
[2016-06-16 11:02:06] [DEBUG ] [workload_detail_volume][SCORSAN02:kernel:vdi_sas-wid13212.DELAY_CENTER_CLUSTER_INTERCONNECT][vdi_sas-wid13212.DELAY_CENTER_CLUSTER_INTERCONNECT] [wait_time] = [0]
[2016-06-16 11:02:06] [DEBUG ] [workload_detail_volume][SCORSAN01:kernel:vdi_sas-wid13212.DELAY_CENTER_DISK_IO][vdi_sas-wid13212.DELAY_CENTER_DISK_IO] [service_time] = [0]
[2016-06-16 11:02:06] [DEBUG ] [workload_detail_volume][SCORSAN01:kernel:vdi_sas-wid13212.DELAY_CENTER_DISK_IO][vdi_sas-wid13212.DELAY_CENTER_DISK_IO] [wait_time] = [674655900722]
[2016-06-16 11:02:06] [DEBUG ] [workload_detail_volume][SCORSAN02:kernel:vdi_sas-wid13212.DELAY_CENTER_DISK_IO][vdi_sas-wid13212.DELAY_CENTER_DISK_IO] [service_time] = [0]
[2016-06-16 11:02:06] [DEBUG ] [workload_detail_volume][SCORSAN02:kernel:vdi_sas-wid13212.DELAY_CENTER_DISK_IO][vdi_sas-wid13212.DELAY_CENTER_DISK_IO] [wait_time] = [0]
[2016-06-16 11:02:06] [DEBUG ] [workload_detail_volume][SCORSAN01:kernel:vdi_sas-wid13212.DELAY_CENTER_NETWORK][vdi_sas-wid13212.DELAY_CENTER_NETWORK] [service_time] = [0]
[2016-06-16 11:02:06] [DEBUG ] [workload_detail_volume][SCORSAN01:kernel:vdi_sas-wid13212.DELAY_CENTER_NETWORK][vdi_sas-wid13212.DELAY_CENTER_NETWORK] [wait_time] = [0]
[2016-06-16 11:02:06] [DEBUG ] [workload_detail_volume][SCORSAN02:kernel:vdi_sas-wid13212.DELAY_CENTER_NETWORK][vdi_sas-wid13212.DELAY_CENTER_NETWORK] [service_time] = [0]
[2016-06-16 11:02:06] [DEBUG ] [workload_detail_volume][SCORSAN02:kernel:vdi_sas-wid13212.DELAY_CENTER_NETWORK][vdi_sas-wid13212.DELAY_CENTER_NETWORK] [wait_time] = [0]
[2016-06-16 11:02:06] [DEBUG ] [workload_detail_volume][SCORSAN01:kernel:vdi_sas-wid13212.DELAY_CENTER_QOS_LIMIT][vdi_sas-wid13212.DELAY_CENTER_QOS_LIMIT] [service_time] = [0]
[2016-06-16 11:02:06] [DEBUG ] [workload_detail_volume][SCORSAN01:kernel:vdi_sas-wid13212.DELAY_CENTER_QOS_LIMIT][vdi_sas-wid13212.DELAY_CENTER_QOS_LIMIT] [wait_time] = [0]
[2016-06-16 11:02:06] [DEBUG ] [workload_detail_volume][SCORSAN02:kernel:vdi_sas-wid13212.DELAY_CENTER_QOS_LIMIT][vdi_sas-wid13212.DELAY_CENTER_QOS_LIMIT] [service_time] = [0]
[2016-06-16 11:02:06] [DEBUG ] [workload_detail_volume][SCORSAN02:kernel:vdi_sas-wid13212.DELAY_CENTER_QOS_LIMIT][vdi_sas-wid13212.DELAY_CENTER_QOS_LIMIT] [wait_time] = [0]
[2016-06-16 11:02:06] [DEBUG ] [workload_detail_volume] data-list poller next refresh at [2016-06-16 11:03:00]
[2016-06-16 11:02:06] [DEBUG ] Sleeping [54] seconds
- Mark as New
- Bookmark
- Subscribe
- Mute
- Subscribe to RSS Feed
- Permalink
- Report Inappropriate Content
Yes! You have data flowing in now!! I would restart it now without the verbose (-v) flag.
Cheers,
Chris Madden
Storage Architect, NetApp EMEA (and author of Harvest)
Blog: It all begins with data
If this post resolved your issue, please help others by selecting ACCEPT AS SOLUTION or adding a KUDO or both!
