Ask The Experts

Why does the amount of available storage shown differ?

Sycraft
1,862 Views

We have a FAS2620 running OnTap 9.5P3 set up with two aggregates, A and B. When I go to the Dashboard on the web page and look at cluster overview, it shows that A is 61% used, and B is 44% used. However when I go to the Aggregates page under storage, it shows that A is 91% used and B is 52% used.


Why is there such a disparity between the two displays and which one is likley to be correct?

3 REPLIES 3

SpindleNinja
1,803 Views

I would guess maybe a bug/glitch in the GUI?   can you post screenshots?   


what's "aggr show" say? 

Sycraft
1,761 Views

Here's the dashboard:
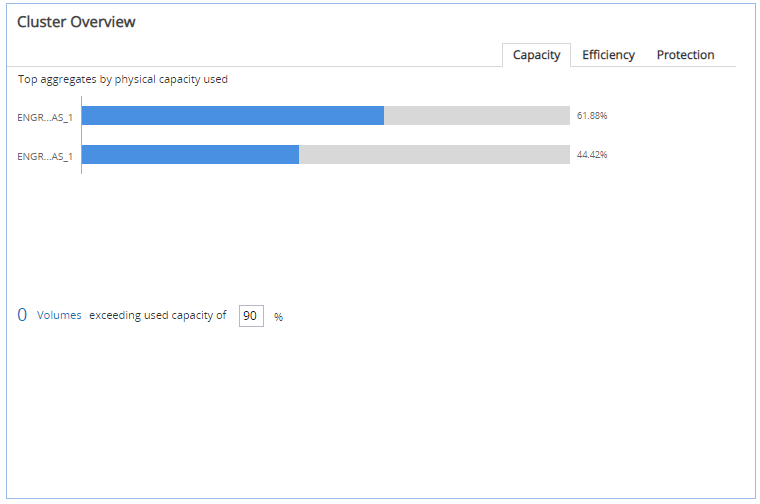
Annotation 2019-05-09 231049.png


And here's the aggregate tab:


Annotation 2019-05-09 231124.png


show aggregate agrees with the information displayed on the aggregate tab. However there are a couple of strange things:


1) I deleted a volume that had 8TB of data... and only 2TB of available space showed up.


2) When I querey the volumes for physical space used, it is not equal to what I am seeing with show aggregate, it is equal to what I'm seeing with the dashboard.


SpindleNinja
1,696 Views

Re: the GUI displays it is odd.  I checked a 9.1 lab filer i have and it's different too.  not as much as yours though.   I'll see if I can do some deeper digging.   


1)   Depends what the "used size" size is.   "vol show -fields used" 


2)  It never will,  there is metadata hanging around WAFL that will add additional space.    

Public