EF & E-Series, SANtricity, and Related Plug-ins
- Home
- :
- Products and Services
- :
- EF & E-Series, SANtricity, and Related Plug-ins
- :
- Re: NetApp Harvest Style Monitoring & Dashboarding for E-Series
EF & E-Series, SANtricity, and Related Plug-ins
- Subscribe to RSS Feed
- Mark Topic as New
- Mark Topic as Read
- Float this Topic for Current User
- Bookmark
- Subscribe
- Mute
- Printer Friendly Page
NetApp Harvest Style Monitoring & Dashboarding for E-Series
- Mark as New
- Bookmark
- Subscribe
- Mute
- Subscribe to RSS Feed
- Permalink
- Report Inappropriate Content
Hi E-Series Users,
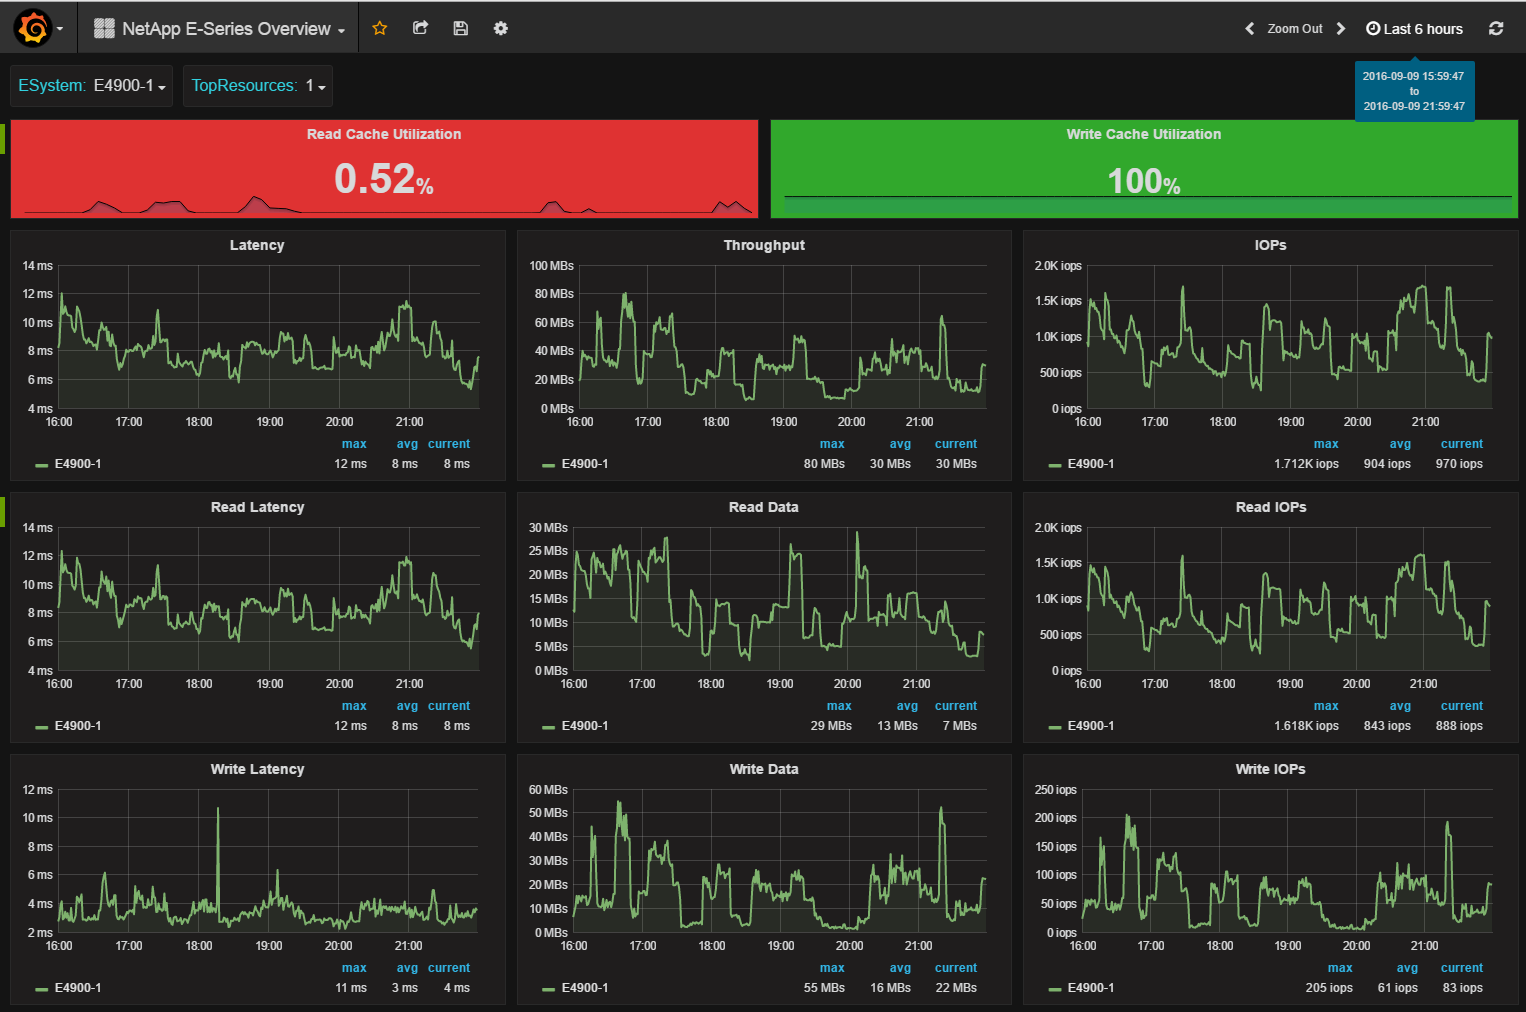
Been exploring the SANtricity Webservices Proxy in order to collect performance metrics from my E-Series Systems, and heavily inspired by Chris Madden's NetApp Harvest I created a metrics collector and a grafana dashboard.
This is a work in progress but would like to see other people giving it a try and feedback any ideas (and why not pull requests)
Enough said, go ahead and check out my github repo
Enjoy,
Pablo.
- Mark as New
- Bookmark
- Subscribe
- Mute
- Subscribe to RSS Feed
- Permalink
- Report Inappropriate Content
Awesome work @PabloZorzoli!
I fired it up in my lab and works like a charm:
We'll have to see how we can collaborate on this one 🙂
Cheers,
Chris Madden
Solution Architect - 3rd Platform - Systems Engineering NetApp EMEA (and author of Harvest)
Blog: It all begins with data
- Mark as New
- Bookmark
- Subscribe
- Mute
- Subscribe to RSS Feed
- Permalink
- Report Inappropriate Content
Hi Pablo,
I'm running NABox 2.3 with Harvest 1.3.
Do you think I can tweak the image to include also the E-series monitoring into it?
Since I have 2 E-5660 running 11.30, I should not have to use SANtricity Web proxy.
If you think this could be useful I can try to plug those into my Harvest setup.
Thanks, Thomas.
- Mark as New
- Bookmark
- Subscribe
- Mute
- Subscribe to RSS Feed
- Permalink
- Report Inappropriate Content
hi @ds
I'm not familiar with that style. I'm also a harvest user for my ontap systems, but I deployed it directly installed via source code files.
Michael Price from netapp has contributed a Dockerized version of the app: https://github.com/plz/E-Series-Graphite-Grafana#docker
Maybe that thing simplifies the way you can deploy my collector.
Good luck
Pablo
- Mark as New
- Bookmark
- Subscribe
- Mute
- Subscribe to RSS Feed
- Permalink
- Report Inappropriate Content
I'm not seeing the counters in the collector but I know they're there from the Web Proxy... is anyone tracking used/free disk/pool space with this? If so, how did you add the counter/collector?
Thanks for the great work.
Ben

