The previous blog post in this series looked at how private CLI passthrough can be leveraged in NetApp® ONTAP® REST. This post looks at 5 magical features that make your storage infrastructure automation so simple.
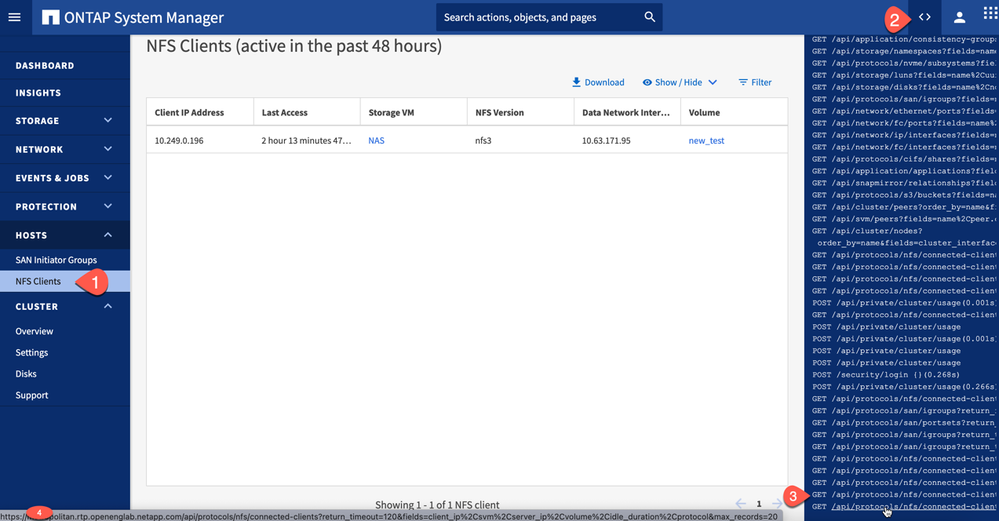
Magic 1: API call logs from System Manager
ONTAP System Manager displays the series of REST API calls made in the ONTAP System Manager API log. Users can leverage this API log to retrieve the specified workflow and use it in their automation scripts.
Watch the video Viewing Call logs in ONTAP System Manager

Magic 2: Programmatic way to find equivalents of ONTAPI calls and REST APIs
We have developed a tool to help our customers and partners transition from ONTAPI (ZAPI) to ONTAP REST API. This tool consists of three Python scripts, covering three different use cases.
The following table describes the scripts.
Note: Python 3.7 or later is required to run the scripts.
Script | Description |
apache_scraper.py | Apache log scraper to find ONTAPIs (ZAPIs) called against ONTAP nodes |
session_stats.py | Command line script to pull session statistics data from ONTAP |
zapi_to_rest.py | Script to find equivalent REST details of ZAPI and attributes passed |
You can download the ONTAPI Usage Reporting tool.
Read the previous post in the series, Episode #4, ONTAPI (ZAPI) reporting tool.
Magic 3: Private CLI passthrough
A CLI command can be executed as an ONTAP REST API call. Yes, it’s true.
Users can execute even advanced and diagnostic mode CLI commands to get advanced attributes per use cases. This option is also helpful for customers and partners to address the existing ONTAPI to REST APIs attribute-level gaps in completing their automation journey.
To learn more, read Using the private CLI passthrough with the ONTAP REST API.
Magic 4: Real-time performance metrics up to a year for numerous storage objects and protocols
ONTAP REST offers performance metrics such as IOPS, latency, and throughput for various storage objects such as storage virtual machines (SVMs), volumes, LUNs, qtrees, and protocols, and also at the cluster and individual node levels.
Performance metrics can be retrieved for hour, day, week, month, and up to a year.
Storage object or protocol | IOPS | Latency | Throughput | ONTAP release |
Cloud volume | RWOT | RWOT | NA | 9.7 |
LUN | RWOT | RWOT | RWOT | 9.7 |
Aggregate | RWOT | RWOT | RWOT | 9.7 |
SVM NFS protocol | RWOT | RWOT | RWT | 9.7 |
SVM CIFS protocol | RWOT | RWOT | RWT | 9.7 |
SVM FCP protocol | RWOT | RWOT | RWT | 9.7 |
SVM iSCSI protocol | RWOT | RWOT | RWT | 9.7 |
SVM NVMe protocol | RWOT | RWOT | RWT | 9.7 |
Cluster | RWOT | RWOT | RWOT | 9.6 |
Volume | RWOT | RWOT | RWOT | 9.6 |
Ethernet port | NA | NA | RWT | 9.8 |
FC port | RWOT | RWOT | RWT | 9.8 |
IP interface | NA | NA | RWT | 9.8 |
FC interface | RWOT | RWOT | RWT | 9.8 |
NVMe namespace | RWOT | RWOT | RWOT | 9.8 |
Qtree statistics | Raw RWOT | NA | Raw RWOT | 9.8 |
Volume FlexCache® | RWOT | RWOT | RWT | 9.8 |
Node – Processor utilization | Processor utilization as a numerical value | |
Magic 5: Python sample scripts, Ansible playbooks, and client library readily available to get started fast
To help our customers get started with ONTAP automation, NetApp provides Ansible playbooks that work seamlessly with ONTAP REST and ONTAPI calls. We also provide a client library for Python consumers and 70+ Python sample scripts for ONTAP day-0, day-1, and day-2 automation use cases.