I'm trying to monitor a CDOT 8.3.1P1 cluster.
My OCUM server is running 7.2RC1, grafana server is running 4.6 on a separate system.
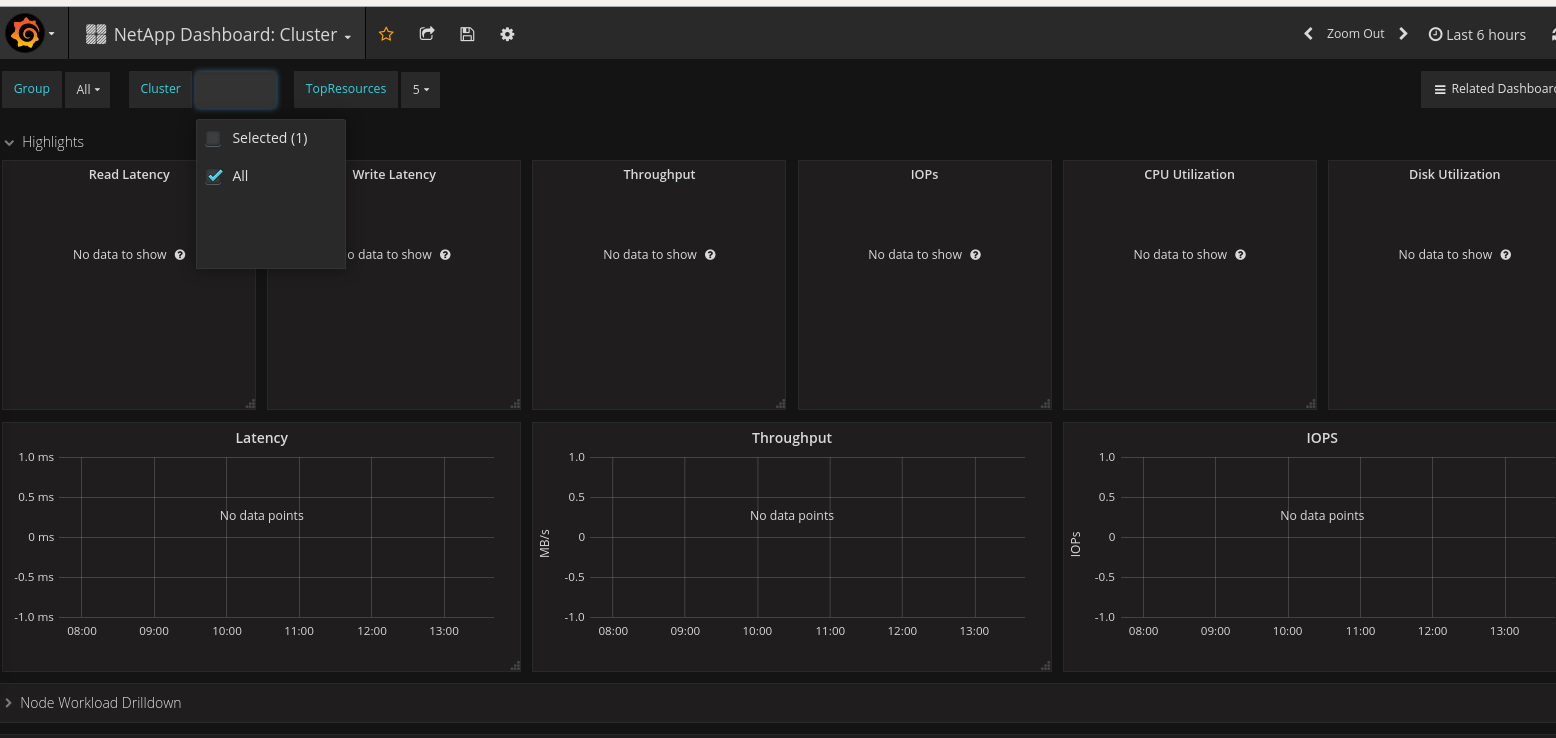
I can see data from my cluster in the graphite database, but nothing appears in the grafana interface.
Nothing stands out in the logs.
Any ideas? netapp-harvest.conf
[global]
grafana_api_key = mykey=
grafana_url = https://stein.ftc.avagotech.net
[default]
graphite_server = stein.ftc.avagotech.net:2003
username = admin
password = admin_password
[cluster_a_wsd]
hostname = 10.10.240.150
host_type = filer
group = netapp-harvest
username = netapp-harvest
password = my_password
[growler]
hostname = 10.10.128.201
username = netapp-harvest
password = my_password
group = netapp-harvest
host_type = OCUM
data_update_freq = 900