This site will enter Read Only mode on July 23 as we prepare to move to a new platform. You will still be able to view content, but posting and replying will be temporarily disabled.
We're excited to launch our new Community experience on July 30 and more information will follow soon.
Stay connected during the transition - Join our Discord community today.
Active IQ Unified Manager Discussions
- Home
- :
- Active IQ and AutoSupport
- :
- Active IQ Unified Manager Discussions
- :
- How to get performance graphs-Clustered Ontap-OCUM 6.2-OCPM 1.0?
Active IQ Unified Manager Discussions
- Subscribe to RSS Feed
- Mark Topic as New
- Mark Topic as Read
- Float this Topic for Current User
- Bookmark
- Subscribe
- Mute
- Printer Friendly Page
How to get performance graphs-Clustered Ontap-OCUM 6.2-OCPM 1.0?
- Mark as New
- Bookmark
- Subscribe
- Mute
- Subscribe to RSS Feed
- Permalink
- Report Inappropriate Content
Hi,
I have cluster mode controllers monitored with OCUM 6.2 (for clustered mode controllers) and OCPM 1.0. I want to pull out performance graphs like you could do with "NetApp Management Console".
How do I do it?
Thanks in advance.
- Mark as New
- Bookmark
- Subscribe
- Mute
- Subscribe to RSS Feed
- Permalink
- Report Inappropriate Content
Hi Kuber.Katana.
If i am correct, You are asking for determining performance issues on clustered dataontap using OPM
In OPM1.0 we can view performance for individual volumes
On the below link check for section --> Determining whether a workload has a performance issue
https://library.netapp.com/ecmdocs/ECMP1364220/html/frameset.html
We can check
- slow response time for a workload as well.
- Identifying victim and bully workloads
- we can determine QOS limit for high performing workload
etc.
-Srinivas
- Mark as New
- Bookmark
- Subscribe
- Mute
- Subscribe to RSS Feed
- Permalink
- Report Inappropriate Content
Thanks for the information Srini. But I am after more detailed graphs. Something that you pull out of DFM 5.1 NetApp management console.
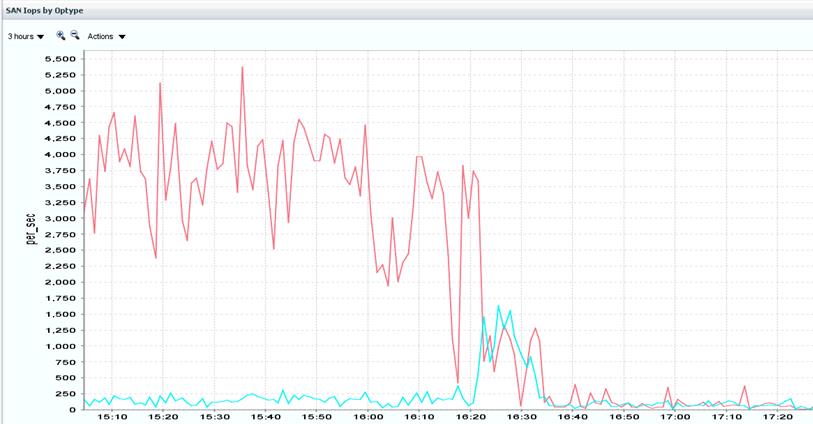
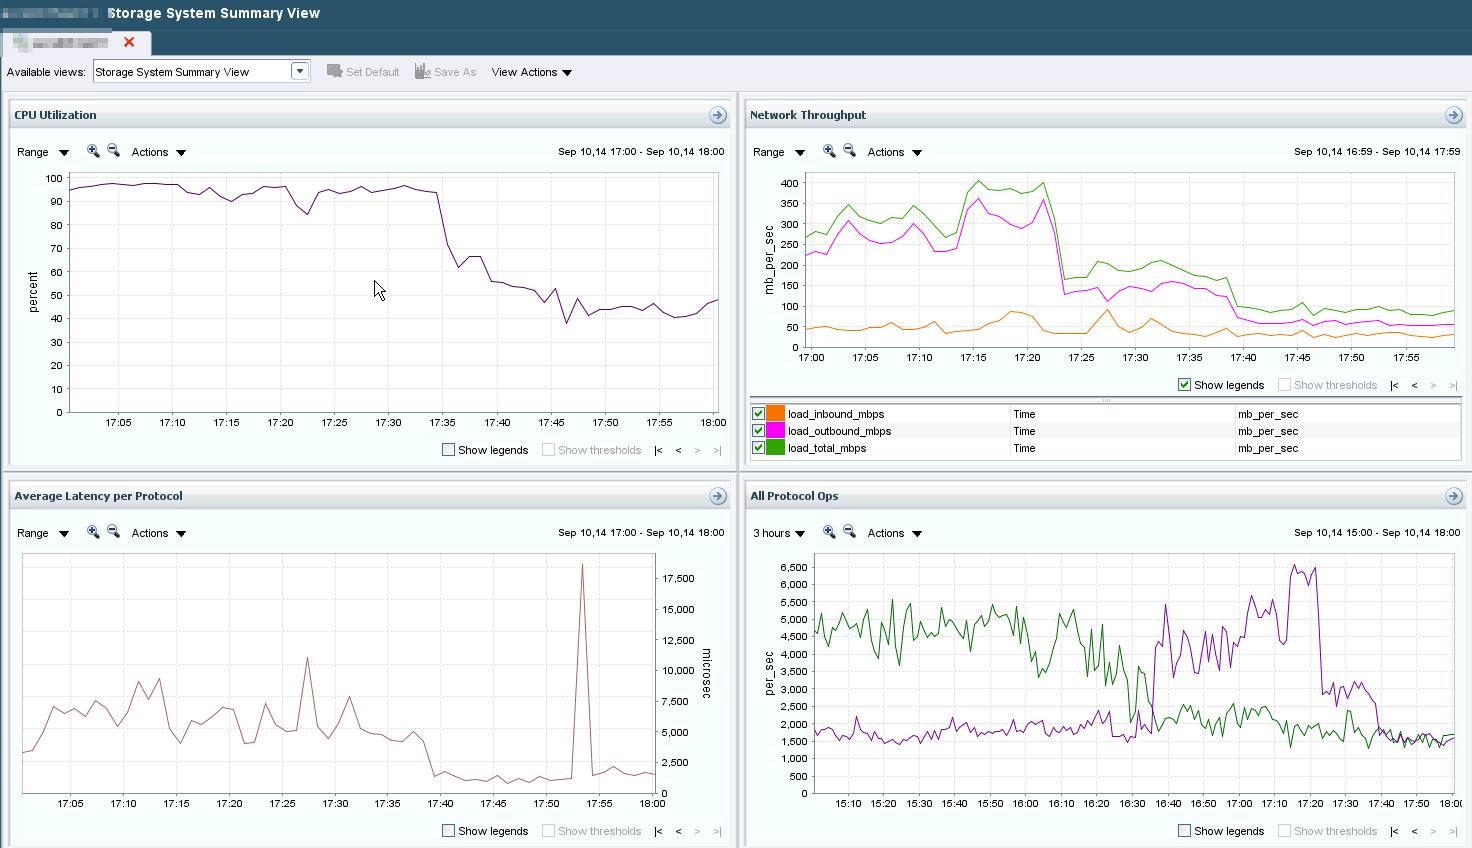
Graphs showing the "Per protocol IOPS", "Latency per protocol","CPU utilization per Node" etc.. I hope this give you an idea about what I am after.
Thanks.
- Mark as New
- Bookmark
- Subscribe
- Mute
- Subscribe to RSS Feed
- Permalink
- Report Inappropriate Content
OPM 1.0 does provide a number of performance graphs for a single volume (user workload). You can see the list here: https://library.netapp.com/ecmdocs/ECMP1364220/html/GUID-40A72B78-E550-4ACC-B823-C15162C7F0B8.html
Mike
- Mark as New
- Bookmark
- Subscribe
- Mute
- Subscribe to RSS Feed
- Permalink
- Report Inappropriate Content
looks like netapp wants to push out customers from system details, so they will always do a perfstat and contact netapp support ?? or is there another license or feature that we only have to pay for ?;(
and we surely have to pay for vmWare to run Monitoring and boxed analysis ??!
- Mark as New
- Bookmark
- Subscribe
- Mute
- Subscribe to RSS Feed
- Permalink
- Report Inappropriate Content
Bump...
I was wondering this same thing. If they are there, they're hidden very well. I found the OnCommand Performance Manager and installed that a few days ago, thinking that's where they were hidden...nope. While OPM does some cool things, it doesn't give you the info you're looking for often.
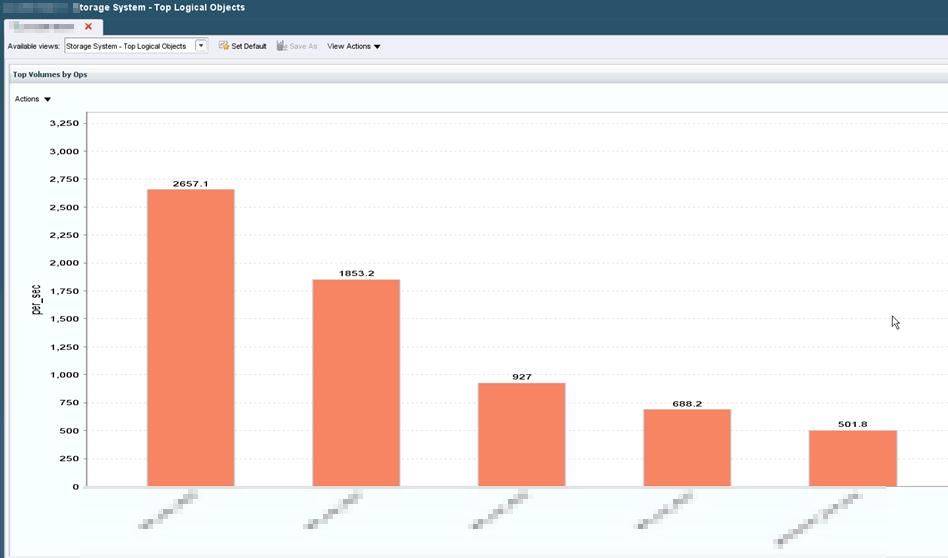
Sure, you can get to a volume IOPS/response time graph...if you search for the volume name in OPM. This is very unintuitive, there is no "browse" option - so you have to know the volume name and type it in the search box. Why can't you get to this from OCUM? Also, you can't see anything higher than a volume, so you can't get a stacked graph of "these are the busiest volumes by order of IOPS". Basically, its pretty useless for troubleshooting.
For example, one of my SQL cluster instances decided to suck a whole ton of IOPS due to a software issue, which was killing the storage system...causing B2B CPs and severely impacting other workloads. Without this per-volume IOPS chart, it would have been very difficult to narrow down. Luckily, this system is still on 7-Mode.
However, it appears that OCUM is substantially inferior to DFM/OC5...There are no real-time CPU charts, IOPS charts (per protocol or per volume), no throughput charts, no disk busy charts, etc.
Unless I'm doing something wrong...
- Mark as New
- Bookmark
- Subscribe
- Mute
- Subscribe to RSS Feed
- Permalink
- Report Inappropriate Content
For the time being, it would probably be a good idea to install OCUM 5.x, in addition to OCUM 6.x, monitoring your CDOT systems. Performance Advisor remains available in 5.x for CDOT, and can provide some information that is not yet available in OPM.
- Mark as New
- Bookmark
- Subscribe
- Mute
- Subscribe to RSS Feed
- Permalink
- Report Inappropriate Content
Hello
OnCommand Performance Manager 1.1 shipped in November 2014. It includes a push API that allows customers to access the performance charts you reference in your post in the tool of their choice, such as open source charting tool Graphite.
Best regards,
Yossi
- Mark as New
- Bookmark
- Subscribe
- Mute
- Subscribe to RSS Feed
- Permalink
- Report Inappropriate Content
Correct me if i am wrong,
With clustered Ontap, DFM 5.2 is minimized in options. Now i can't create custom views anymore, so i can't add things like flash counters, or other "in depth" information.
Instead of DFM Clustered Ontap now uses Unified Manager, and if i need to see perfromane incidents i have to import another appliance calles Performance monitor.
All this results in less information in a more complicated storage enviroment?! And if i want more in depth information about my storage, i need to use the api and some third party tools to present it?
Or use powershell..?
- Mark as New
- Bookmark
- Subscribe
- Mute
- Subscribe to RSS Feed
- Permalink
- Report Inappropriate Content
Yossi hit the target in his reply above. For Clustered ONTAP since you have OCUM 6.2 you now definitely want OCPM 1.1 (still in release candidate stage I think, but worth getting it). While an exact equivalent of the Management Console from DFM isn't coming back, NetApp isn't cutting off users. OCPM 1.1 has the push feature mentioned that let you push statistics out to third party tools. It also has a MySQL database engine behind the scenes to which users can directly connect to get performance data from the system - much like the old "dfm perf" commands we had back in the day to get all the counters.
Like a lot of Clustered Data ONTAP, the performance tools have taken a while to catch up. I've run the dual setup (DFM 5.2/OCUM 6.X) for a while just so I could access the data collected for creating my own performance graphs, even though the data has been way more limited. Will be nice to drop down to one set of collection tools again.
- Mark as New
- Bookmark
- Subscribe
- Mute
- Subscribe to RSS Feed
- Permalink
- Report Inappropriate Content
Any help on how to extract data using MYSQL db or other ways. I just upgraded OCUM and OCPM to latest RC version just beacuse of this feature but don't know how to pull the data - specially volume wise stats.
- Mark as New
- Bookmark
- Subscribe
- Mute
- Subscribe to RSS Feed
- Permalink
- Report Inappropriate Content
Hi,
You can query the OCUM database using powershell. See example in the link below
You will need to modify the SQL
/matt
- Mark as New
- Bookmark
- Subscribe
- Mute
- Subscribe to RSS Feed
- Permalink
- Report Inappropriate Content
thanks . i am looking to query OCPM 1.1 using some 3rd party tools. specially interested in getting metric like IOPS , Latency , cpu etc in cDOt . trying to find ways to use Graphite but couldn't find much information. any help appreciated.
- Mark as New
- Bookmark
- Subscribe
- Mute
- Subscribe to RSS Feed
- Permalink
- Report Inappropriate Content
On a Windows desktop, I found the easiest way was to spin up a Ubuntu VM and use Synthesize:
https://github.com/obfuscurity/synthesize/
This is far from ideal though, not a solution I could hand over to the service desk team.
- Mark as New
- Bookmark
- Subscribe
- Mute
- Subscribe to RSS Feed
- Permalink
- Report Inappropriate Content
thanks .
- Mark as New
- Bookmark
- Subscribe
- Mute
- Subscribe to RSS Feed
- Permalink
- Report Inappropriate Content
Found a few more blogs which may help people in setting this up.
http://www.dburkland.com/how-to-setup-graphite-to-visualize-oncommand-performance-manager-data/
http://transitiontactician.com/?p=58
- Mark as New
- Bookmark
- Subscribe
- Mute
- Subscribe to RSS Feed
- Permalink
- Report Inappropriate Content
Hello
Now that OPM 2.0 has shipped, we expect many customers to be happy with the performance charting capabilities in it. For these that want to go further, we continue to support the connector to send OPM calculated metrics into a 3rd party charting tool.
Yossi
- Mark as New
- Bookmark
- Subscribe
- Mute
- Subscribe to RSS Feed
- Permalink
- Report Inappropriate Content
Hello
We will be posting some additional documentation soon on best practices for getting Graphite set up and running. Longer term we are considering releasing a VM Appliance with Graphite pre-configured in it to facilitate "one click deployment". Please ask your sales representative to connect with his Managebility CSE for more information.
