VMware Solutions Discussions
- Home
- :
- Virtualization Environments
- :
- VMware Solutions Discussions
- :
- Re: Partial Writes with VMWare ESX hosts
VMware Solutions Discussions
- Subscribe to RSS Feed
- Mark Topic as New
- Mark Topic as Read
- Float this Topic for Current User
- Bookmark
- Subscribe
- Mute
- Printer Friendly Page
- Mark as New
- Bookmark
- Subscribe
- Mute
- Subscribe to RSS Feed
- Permalink
- Report Inappropriate Content
Hi all,
We are experiencing performance problems in our environment and it points to partial writes. We are seeing back-to-back CPs that is causing a spike in latency across all volumes on a filer to above 500ms.
We have contacted NetApp support and they have said yes it is partial writes and it is probably caused by ESX. The filer is almost dedicated to ESX so it has to be ESX, we know all our VMs are unaligned but short of aligning 1000’s of VMs we want to target a few that are causing the most havoc.
How can we narrow it down to a VM level accurately, which ones are causing us the most pain?
Cheers.
- Mark as New
- Bookmark
- Subscribe
- Mute
- Subscribe to RSS Feed
- Permalink
- Report Inappropriate Content
You might want to take a look at vscsistats and/or the nfstop tool to get an idea of which VMs are creating the highest workload. Check out this post on Yellow-Bricks.
- Mark as New
- Bookmark
- Subscribe
- Mute
- Subscribe to RSS Feed
- Permalink
- Report Inappropriate Content
Hi, we are experiencing HUGE 1,000,000+ microseconds (1 second+) latency spikes on ONTAP 7.3.3 NFS volumes as reported by NetApp Management Console which is disabling VMware virtual machines (Windows SQL server needs to be rebooted, Linux VMs go into read only mode and need reboots etc)
We have a case open with Netapp (2001447643) and the latest analysis of perstat and archive stats from the spikes is being presented to us:
"Version:1.0 StartHTML:0000000149 EndHTML:0000003705 StartFragment:0000000199 EndFragment:0000003671 StartSelection:0000000199 EndSelection:0000003671
This data is definitely good. We are seeing the latency.
Here is what I am seeing on the filer side:
Server rpc:
TCP:
calls badcalls nullrecv badlen xdrcall
232298 4294959566 0 0 4294959566
The NetApp filer is getting a huge number of bad XDR calls, indicating that the filer is unable to read the NFS headers.
We cannot determine at this time what the source of these bad calls is.
Some of the worst offending volumes during this period, regarding latency appear to be:
Vm64net
Vm65net
Vw65net2
Vm65net3
Ora64net02
Time Time Delta Volume Parent Aggr Total Op/s Avg Lat (µs) Read Op/s Read Data (B/s) Read Lat (µs) Write Op/s Write Data (B/s) Write Lat (µs) Other Op/s Other Lat (µs)
Tue Jun 15 17:45:46 UTC 2010 0.00 vm64net aggr1 311.00 6,981,691.95 35.00 336,402.00 1,336,540.48 267.00 1,561,500.00 7,953,614.68 8.00 4.29
Tue Jun 15 17:45:46 UTC 2010 0.00 vm65net aggr1 115.00 6,283,673.41 0.00 2,453.00 38,863.33 107.00 1,441,475.00 6,714,803.11 6.00 12.41
Tue Jun 15 17:45:46 UTC 2010 0.00 vm65net3 aggr1 292.00 3,481,462.35 14.00 110,824.00 1,390,729.32 263.00 1,582,710.00 3,780,725.12 14.00 6.82
Tue Jun 15 17:45:46 UTC 2010 0.00 ora64net02 aggr1 17.00 3,280,731.47 5.00 92,421.00 4,776.50 7.00 24,536.00 7,710,536.08 4.00 2.77
Tue Jun 15 17:45:46 UTC 2010 0.00 vm65net2 aggr1 315.00 2,838,381.82 11.00 56,383.00 22,902.19 287.00 1,805,548.00 3,105,157.06 15.00 21.81
Out best bet to track down the source of the bad calls would be to capture a packet trace from the filer when this issue is occurring."
My points I’d like to clarify:
- What is a bad XDR call and why are they relevant to the latency spike?
- “indicating that the filer is unable to read the NFS headers” - need you to clarify and expand
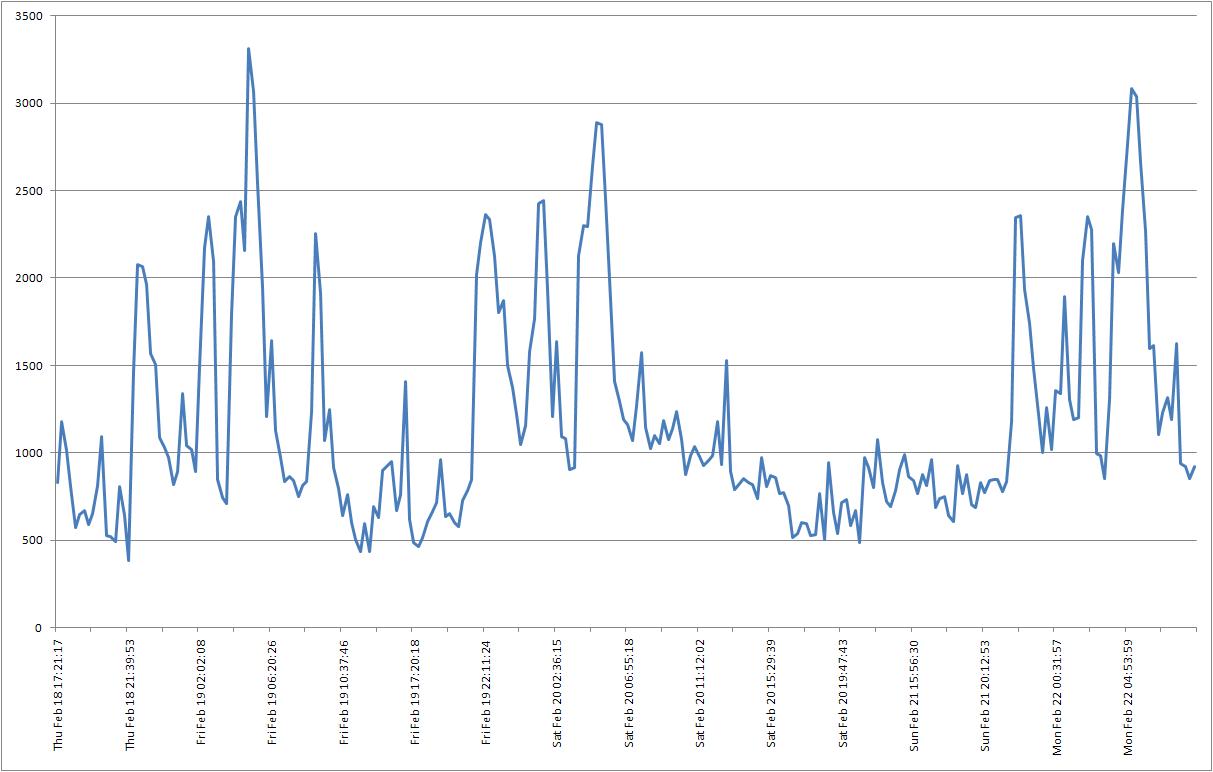
- We saw another smaller spike around 2:30am today:
These are all volumes on aggregate aggr1 (10K RPM disks) is this an overloaded (IOPS-wise) AGGR issue?
We can't currently predict when these spikes in latency occur - they are random - so getting a packet capture of a random event does not seem feasible...
Any insight is welcome - we are in major pain with this for months now
thanks
- Mark as New
- Bookmark
- Subscribe
- Mute
- Subscribe to RSS Feed
- Permalink
- Report Inappropriate Content
Hi,
with which FAS you are working with?
how many hosts do you have?
how many vms do you have?
I did a short look over your sysstat output and read the following:
- row 2 needs to be shifted 4 columns to the right
- very high CPU load (more than 95%)
- NFS only
- very high Net in and out (in: 701142 KB/s, out: 484975 KB/s)
- very high Disk read and write (read: 991328 KB/s, write: 886479 KB/s)
are you sure that these numbers are correct?
Supposed that's correct, i think your netapp is overloaded or undersized
Erich
- Mark as New
- Bookmark
- Subscribe
- Mute
- Subscribe to RSS Feed
- Permalink
- Report Inappropriate Content
Are you hosting the VMs on LUNs? Over NFS?
If you're curious about which ones are causing the most pain, collecting a perfstat and working with NetApp Support will be your best bet.
- Mark as New
- Bookmark
- Subscribe
- Mute
- Subscribe to RSS Feed
- Permalink
- Report Inappropriate Content
FAS6080
We have 42 ESX Hosts
We have approx 1500 Hosts
I think the filer is overloaded yes, but i beleive it is because of the number of partial writes that are occuring. If all VMs (especially the highest IO ones) were aligned I would think the filer could handle the given workload quite comfortably.
We are utilising NFS datastores.
I have engaged NetApp support but i am asking here to try and get some information from people that may have experianced VM alignment problems before.
Another Note:
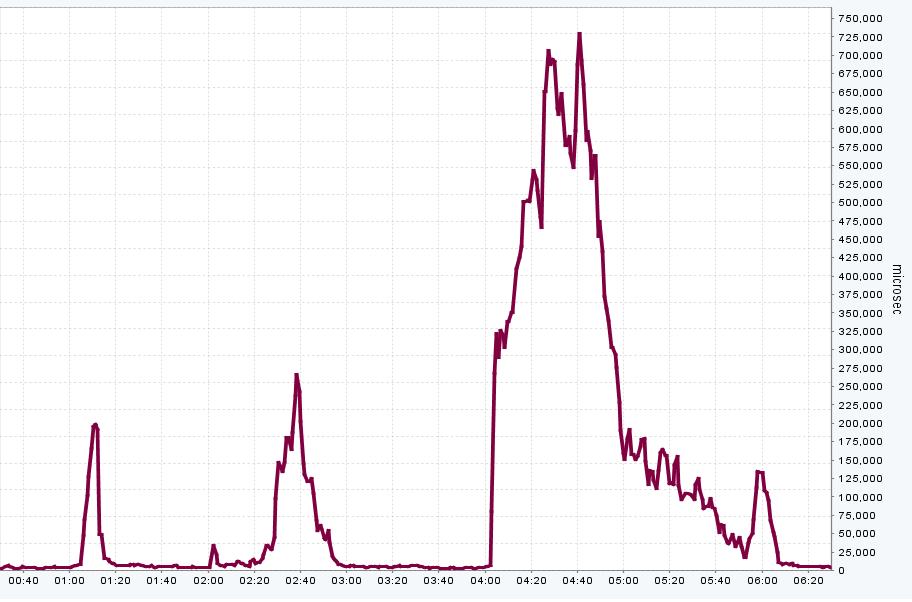
I have written a script to poll the filer every 15mins and get pw.over_limit stat from wafl_susp -w. I have found at times this number grows by 3000 counts /s. See attached graph over_limt. These large spikes correspond to when we see massive latency jumps on our filers (4am everyday). We are still trying to work out what happens at this time to cause this massive IO spike (and subsequent latency spike), but i still beleive the root cause is unaligned VMs. Any comments appreciated.
- Mark as New
- Bookmark
- Subscribe
- Mute
- Subscribe to RSS Feed
- Permalink
- Report Inappropriate Content
We have the exact same problem on our IBM Nseries (rebranded Netapp)
All our ESX hosts are using FC and allmost all of our 1000+ virtual servers are unaligned.. We have approx. 60 mill pw.over_limit every 24 hours and our latency is going from a few ms to more than a second if someone is doing excessive writes.
Recently we started aligning the virtual servers using software from VisionCore, -but it's a very time consuming process and we expect to use the next 6-12 months aligning.
We qualified the top writers (LUNS) using Operations manager and our ESX guru found the virtual servers using the most busy luns.
We are about 10% done, but haven't seen any major improvements yet - but we're still optimistic..!
/Henrik
- Mark as New
- Bookmark
- Subscribe
- Mute
- Subscribe to RSS Feed
- Permalink
- Report Inappropriate Content
Hi, this thread shows up on the top of "Netapp Latency Spikes" searches.
We have a 3040 cluster hosting 11 vSphere hosts with 200 VMs on NFS datastores.
We see latency spikes 3-4 times a month as reported by Operations Manager.
We hoped our upgrade from 7.3.1.1 last week to 7.3.3 would help, but we had another spike up to 1 second take out a NFS mount and all several of the VMs on Saturday.
We previously determined the High & medium IO VMs and either aligned them or migrated them to local disk - has NOT helped - still getting the spikes.
I have another case opened with Netapp.
Following the notes in this thread, I ran the wafl_susp -w to check the pw.over_limit
Turns out ours is ZERO (is it relevant to NFS?)
I suspect an internal Netapp process is responsible for these (dedup?) - we had it disabled on 7.3.1.1 - 7.3.3 was supposed to fix this (we re-enabled de-dup after the upgrade)
And the latency spike outages are back
Will share any info from the case
thanks for any tips,
Fletcher.
- Mark as New
- Bookmark
- Subscribe
- Mute
- Subscribe to RSS Feed
- Permalink
- Report Inappropriate Content
Hi
We have seen excessive responsetimes, when the system did aggregate snapshots.. Try comparing the aggr snap schedule to your response time problems..
Our aggr snap problem might be related to the misalignment.
"snap sched -A"
brgds
/henrik
- Mark as New
- Bookmark
- Subscribe
- Mute
- Subscribe to RSS Feed
- Permalink
- Report Inappropriate Content
Henrik, yes we disabled AGGR snapshots over a year ago
Still searching for an explanation for the spikes
- Mark as New
- Bookmark
- Subscribe
- Mute
- Subscribe to RSS Feed
- Permalink
- Report Inappropriate Content
Basic question: Do you have at least 20% free space in all aggregates?
- Mark as New
- Bookmark
- Subscribe
- Mute
- Subscribe to RSS Feed
- Permalink
- Report Inappropriate Content
No, we have 90% allocation in most (with aggregate snapshots disabled)
thanks
- Mark as New
- Bookmark
- Subscribe
- Mute
- Subscribe to RSS Feed
- Permalink
- Report Inappropriate Content
No doubt it's a problem for performance
- Mark as New
- Bookmark
- Subscribe
- Mute
- Subscribe to RSS Feed
- Permalink
- Report Inappropriate Content
After I took apart the 6800+ IOPS on the problem aggregate the issue turned out to be we were hitting physical limitations of the 10K RPM disks.
Further analysis (surprisingly) revealed about 50% of these IOPS were snapmirror related.
We rescheduled the snapmirrors to reduce this and have said goodbye to the latency spikes.
If interested in the details, please see:
http://www.vmadmin.info/2010/07/vmware-and-netapp-deconstructing.html
I want to thank Netapp support - especially Errol Fouquet for his expertise pulling apart this problem and help isolating the cause.
Fletcher.
- Mark as New
- Bookmark
- Subscribe
- Mute
- Subscribe to RSS Feed
- Permalink
- Report Inappropriate Content
Hi,
A quick followup outlining how we currently quantify the misalignment issue:
http://www.vmadmin.info/2010/07/quantifying-vmdk-misalignment.html
Cheers
- Mark as New
- Bookmark
- Subscribe
- Mute
- Subscribe to RSS Feed
- Permalink
- Report Inappropriate Content
Hi
Here's our TR on how to align filesystems
http://media.netapp.com/documents/tr-3747.pdf
Hope this helps.
Regards
Amrita
