This site will enter Read Only mode on July 23 as we prepare to move to a new platform. You will still be able to view content, but posting and replying will be temporarily disabled.
We're excited to launch our new Community experience on July 30 and more information will follow soon.
Stay connected during the transition - Join our Discord community today.
Active IQ Unified Manager Discussions
- Home
- :
- Active IQ and AutoSupport
- :
- Active IQ Unified Manager Discussions
- :
- Error to import all dashboards from the grafana to harvest
Active IQ Unified Manager Discussions
- Subscribe to RSS Feed
- Mark Topic as New
- Mark Topic as Read
- Float this Topic for Current User
- Bookmark
- Subscribe
- Mute
- Printer Friendly Page
Error to import all dashboards from the grafana to harvest
- Mark as New
- Bookmark
- Subscribe
- Mute
- Subscribe to RSS Feed
- Permalink
- Report Inappropriate Content
Hi all,
I installed/configured Harvest on RHEL 6.6, everything works fine except I could not export the dashboads. Here is the error:
[root@ICPLPA06 log]# /opt/netapp-harvest/netapp-manager -import
[OK ] Will import dashboards to http://10.125.10.130:443
[OK ] Imported dashboard [db_netapp-detail-harvest-poller.json] successfully
[OK ] Imported dashboard [db_netapp-detail-network-lif.json] successfully
[ERROR ] Failed to import dashboard [db_netapp-detail-7-mode-lun.json] due to error: 500 write failed: Connection reset by peer
[ERROR ] -Response was :500 write failed: Connection reset by peer --> we have a cluster with six nodes (2 FAS8040 and FAS8020)
We have not a 7mode.
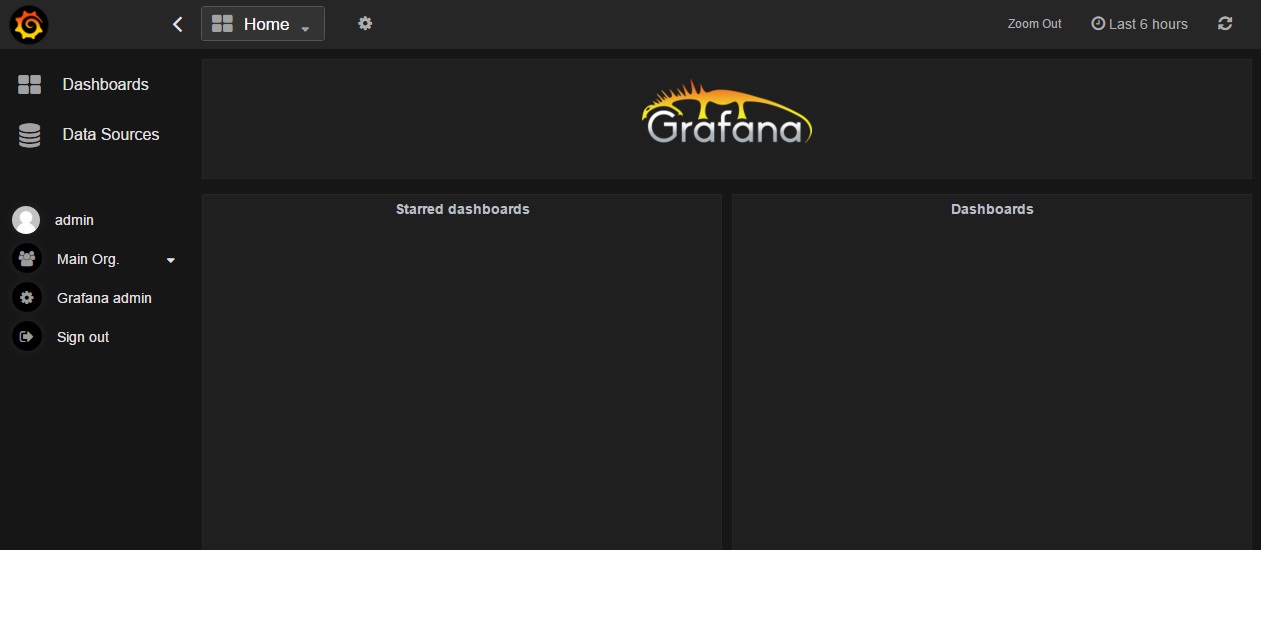
In grafana we can not see the dashboard.
In graphite is collecting data from OCUM (They are capacity data) But the performance data that Harvest collects are not being updated.
I attached a pics of Grafana.
Configuration netapp-harvest.conf:
[root@ICPLPA06 netapp-harvest]# cat netapp-harvest.conf
##
## Configuration file for NetApp Harvest
##
## Create a section header and then populate with key/value parameters
## for each system to monitor. Lines can be commented out by preceding them
## with a hash symbol ('#'). Values in all capitals should be replaced with
## your values, all other values can be left as-is to use defaults
##
## There are two reserved section names:
## [global] - Global key/value pairs for installation
## [default] - Any key/value pairs specified here will be the default
## value for a poller should it not be listed in a poller section.
##
##
## Global reserved section
##
[global]
grafana_api_key = eyJrIjoiYXhDNktrQTJqMzhGd3ZmOUJkNVRnN01vMmhrczdBMjQiLCJuIjoibmV0YXBwLWhhcnZlc3QiLCJpZCI6MX0=
grafana_url = http://10.125.10.130:443
grafana_dl_tag =
##
## Default reserved section
##
[default]
#====== Graphite server setup defaults ========================================
graphite_enabled = 1
graphite_server = ICPLPA05
graphite_port = 2003
graphite_proto = tcp
normalized_xfer = mb_per_sec
normalized_time = millisec
graphite_root = default
graphite_meta_metrics_root = default
#====== Polled host setup defaults ============================================
host_type = FILER
host_port = 443
host_enabled = 1
template = default
data_update_freq = 60
ntap_autosupport = 0
latency_io_reqd = 10
auth_type = password
username = netapp-harvest
password = netapp00
ssl_cert = netapp-harvest.pem
ssl_key = netapp-harvest.key
##
## Monitored host examples - Use one section like the below for each monitored host
##
#====== 7DOT (node) or cDOT (cluster LIF) for performance info ================
#
[CLOALMPCDOT01]
hostname = 10.125.1.72
site = cloud
#====== OnCommand Unified Manager (OCUM) for cDOT capacity info ===============
#
[cloapa01]
hostname = 10.125.10.186
site = cloud
host_type = OCUM
data_update_freq = 900
normalized_xfer = gb_per_sec
I need your help!!
Best Regards,
Jorge
Solved! See The Solution
- Mark as New
- Bookmark
- Subscribe
- Mute
- Subscribe to RSS Feed
- Permalink
- Report Inappropriate Content
Hi @Jorge_dpc
It looks like your grafana_url parameter uses http and port 443. Probably you want https.
Cheers
Chris Madden
p.s. If this solves your issue please mark this answer as correct so others can find it easily.
- Mark as New
- Bookmark
- Subscribe
- Mute
- Subscribe to RSS Feed
- Permalink
- Report Inappropriate Content
Yes!!
I changed the .conf and URL with https and everything right!
thanks!
