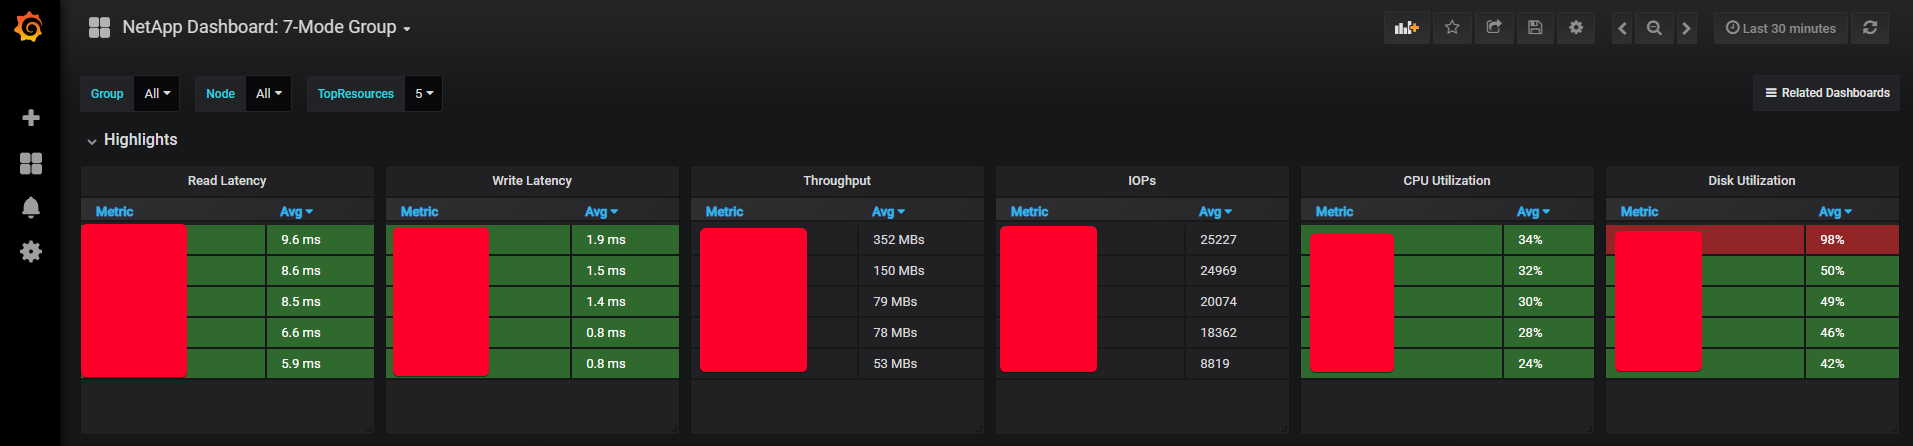
We have a grafana + grphite + harvest installation for collecting the metrics from storge. We have asked to upgrade grafana by our security team as we were using 4.5 version to latest version. I have uninstalled older version and installed a new version (5.2.1). Installation went without any issue. After upgrading, in the dashabord, whenver i select specific group, it doesnot show any value. Dashboard shows value when i select "all" and "mutiple group names". Tried re-importing the dashboards using netapp-manager/re-added graphite database, tried modifying the queries for given dashboard, none has solved the problem. Please find attachment where you can see, when "all" value is selected, dashboard shows metrics. When i select "one of the group", it shows no metrics. When i select "more thant one group", it shows metrics. I am sure this is a problem with Grafana. If someone encountered this issue and have a fix, can you please share?
thanks

